“Data has been traditionally visualized through the desktop model, but current and anticipated advancements in material science and digital fabrication are radically changing how we can possibly represent and interact with data.”
Data experiments
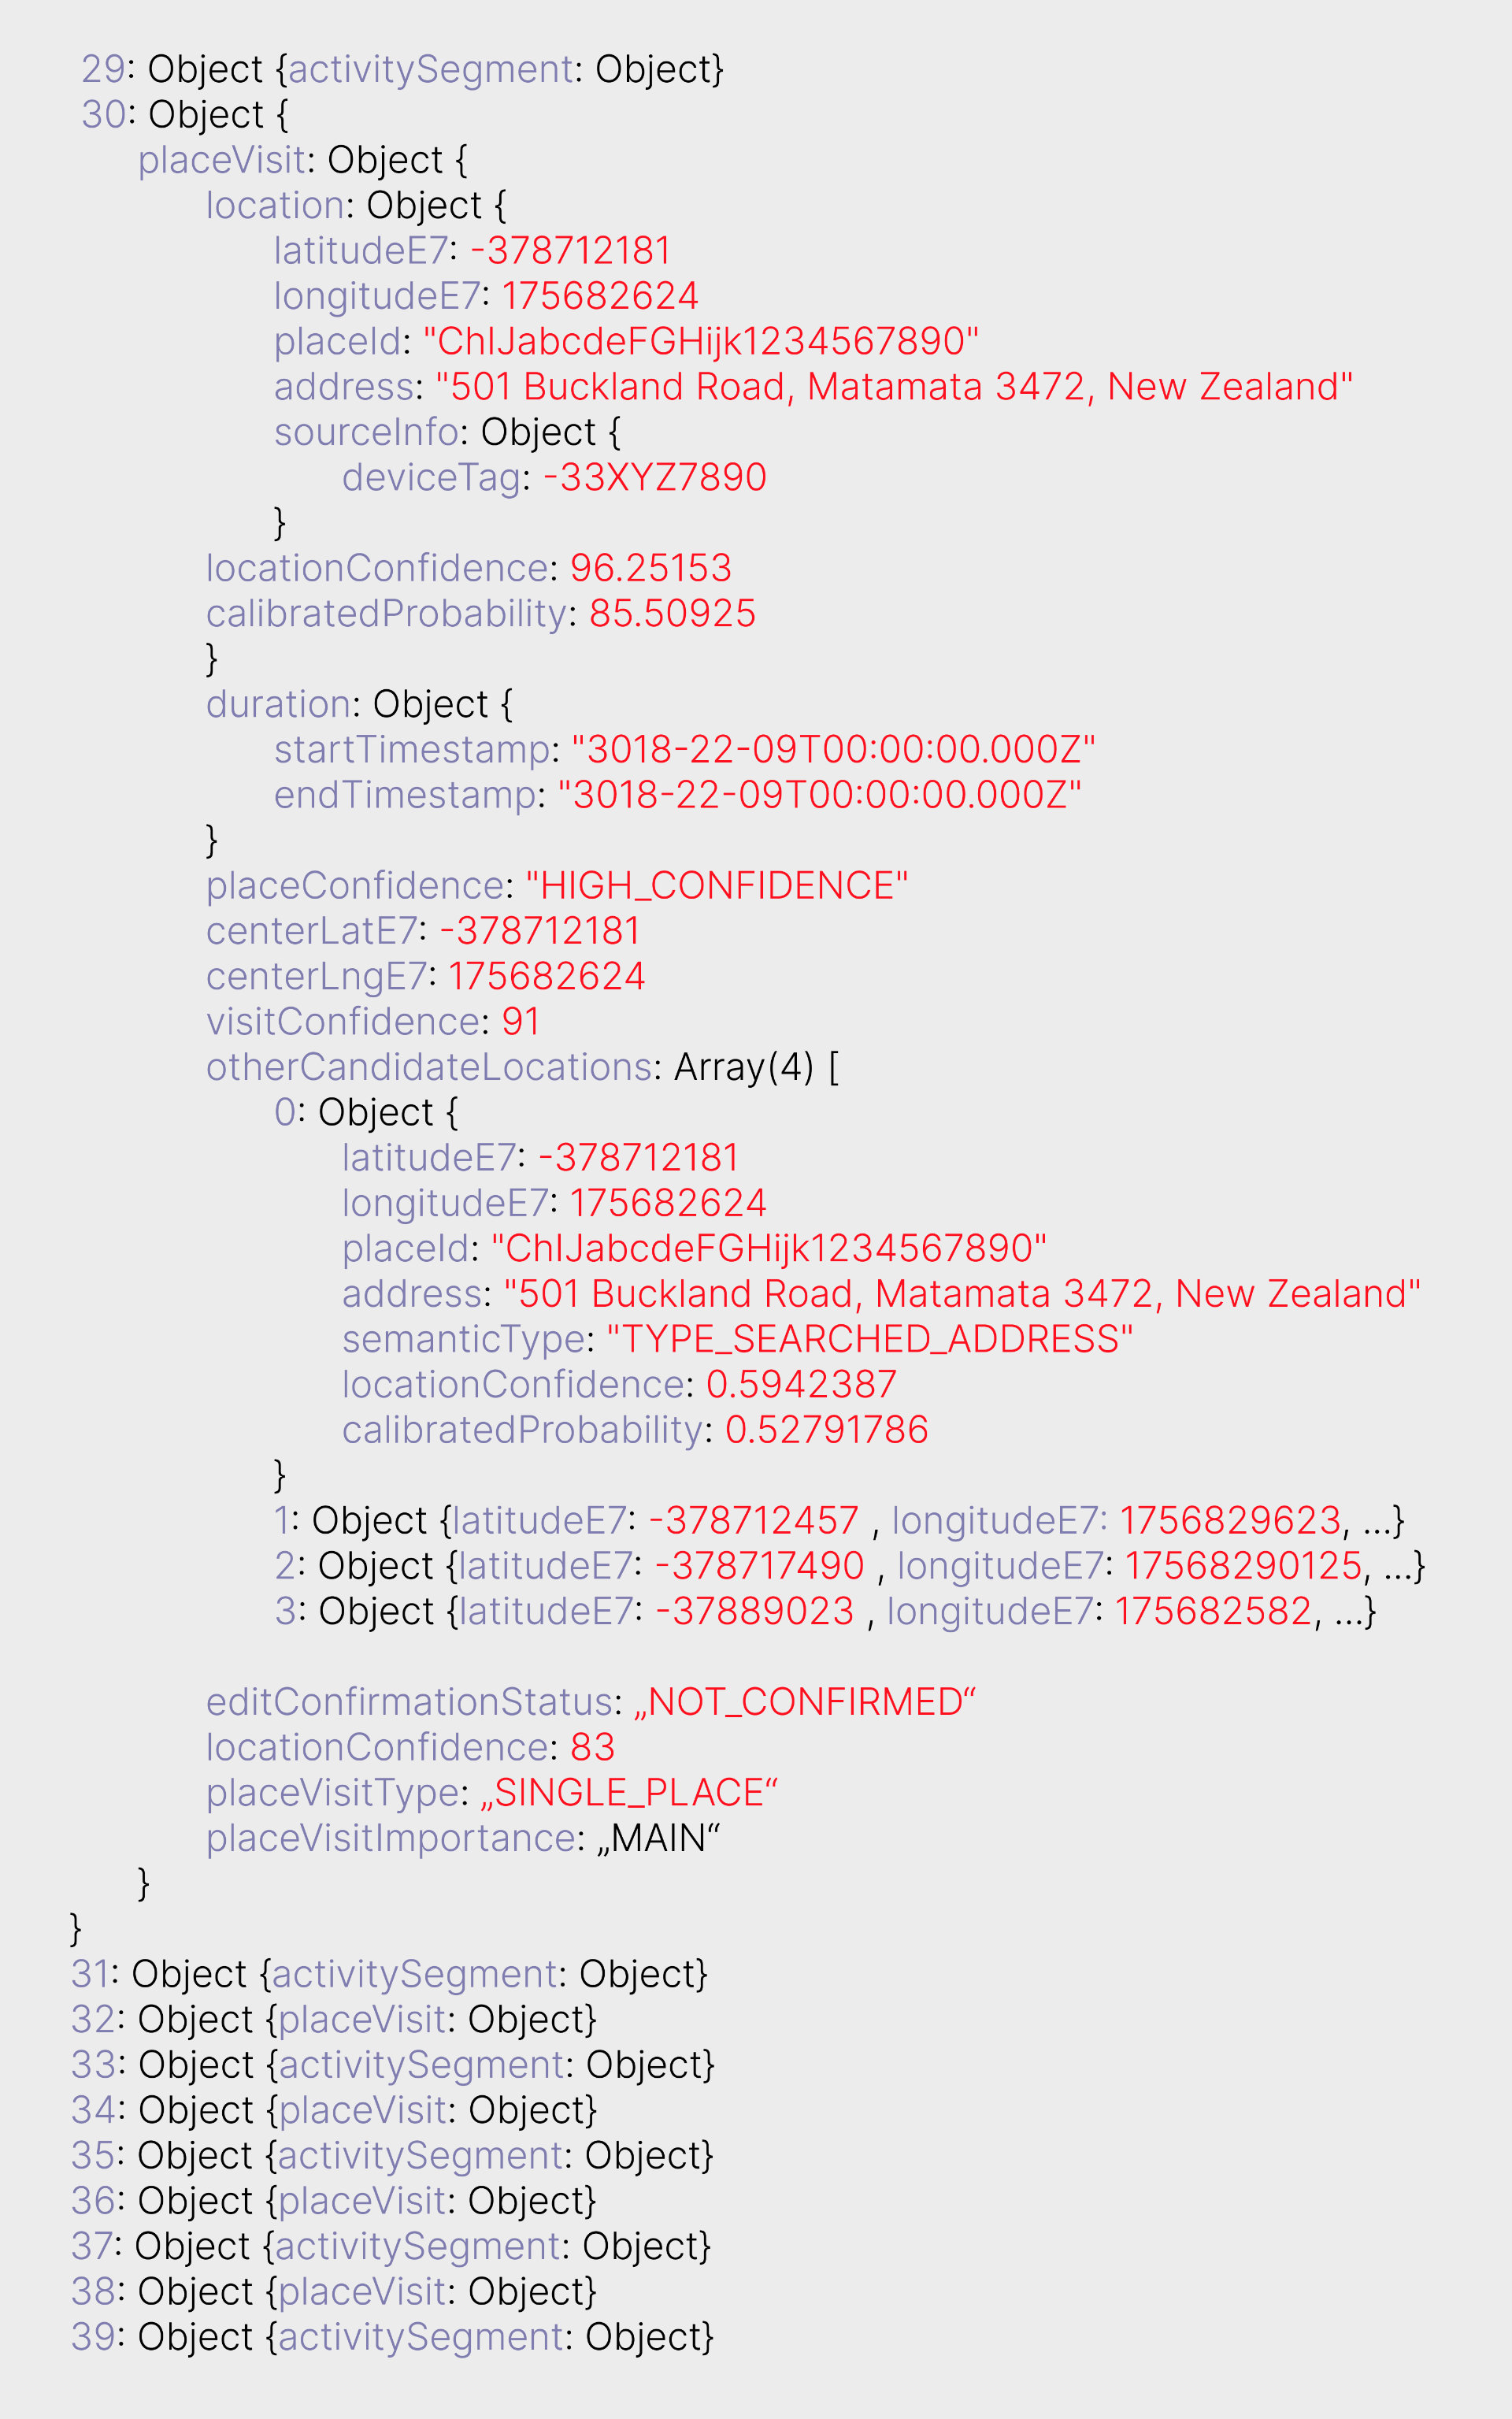
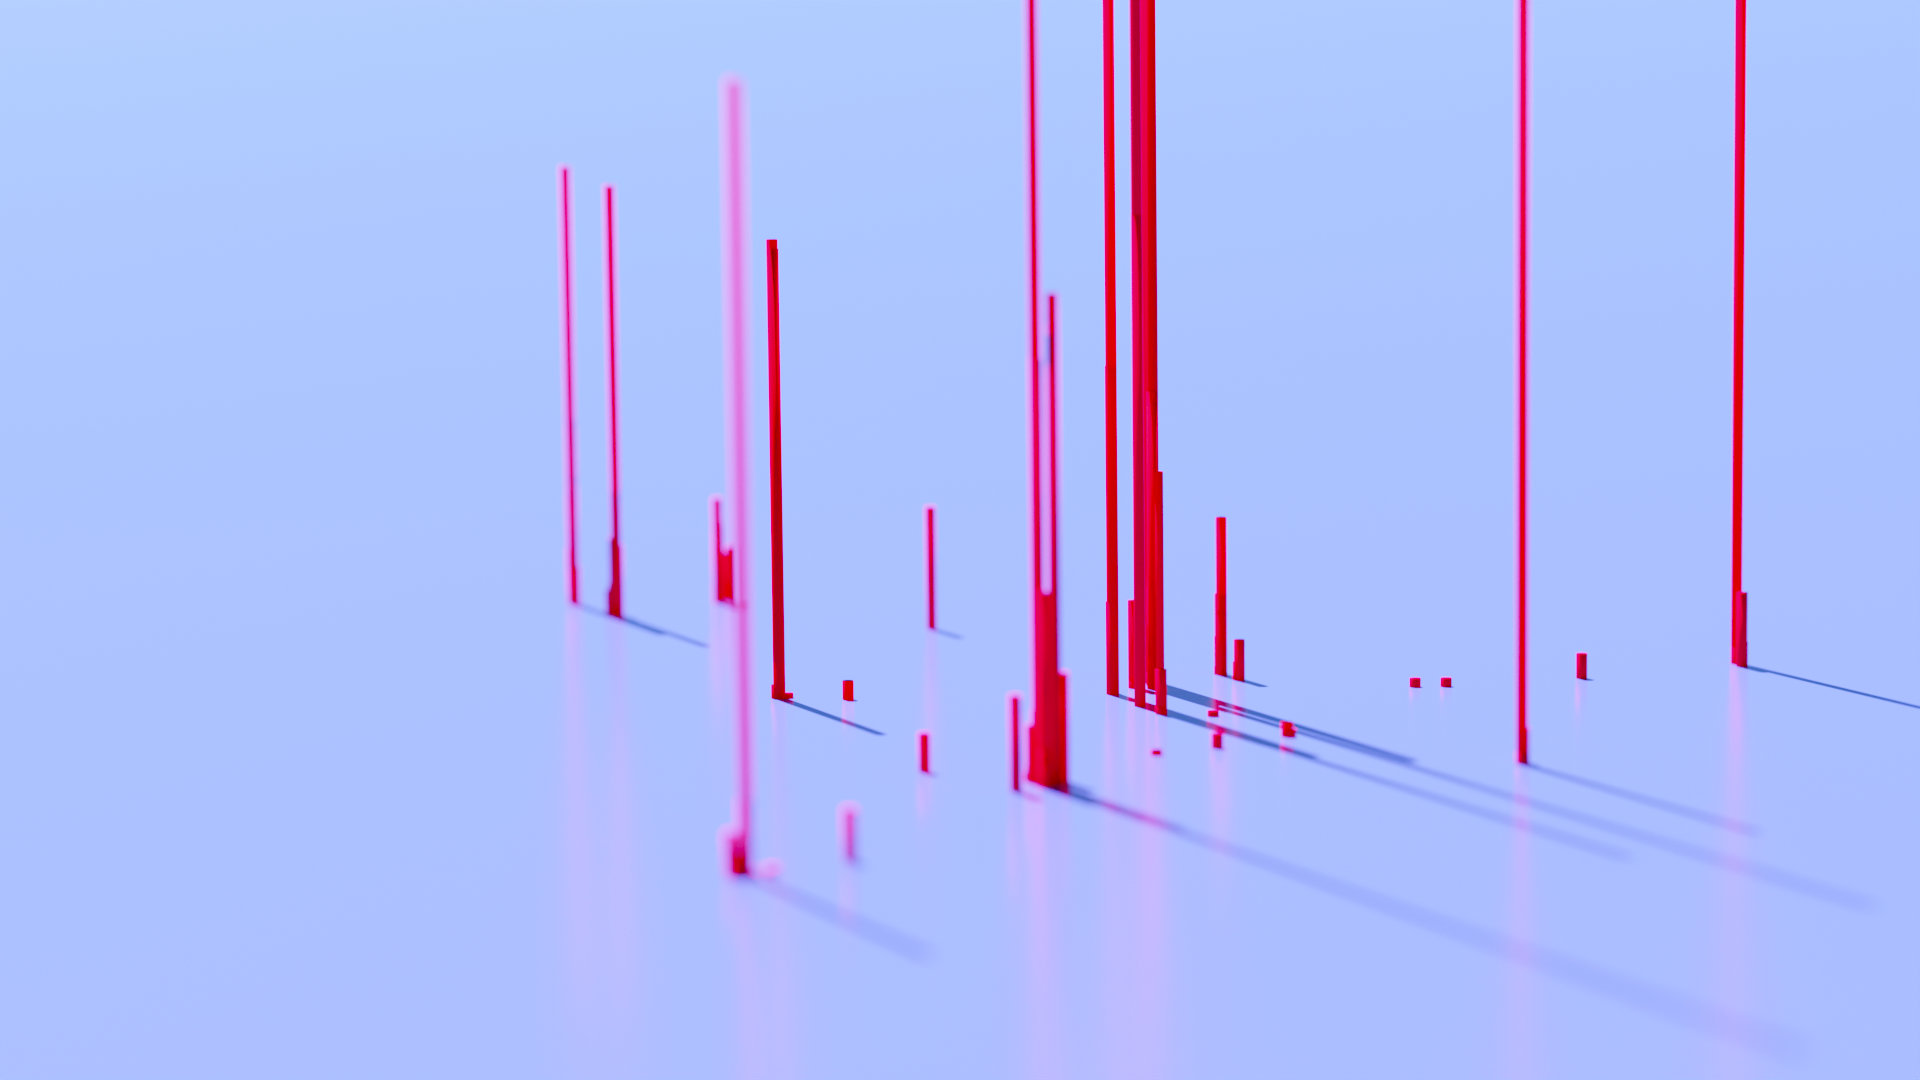
In the initial phase of my practical design process, I conducted experiments in both visualization and physicalization. Exploring data visualization, I began by visualizing my personal location data collected by Google. Progressing further, I ventured into three-dimensional data visualization using a Python script and Blender Geometry Nodes. With a non-destructive setup, I could effortlessly visualize various external datasets.


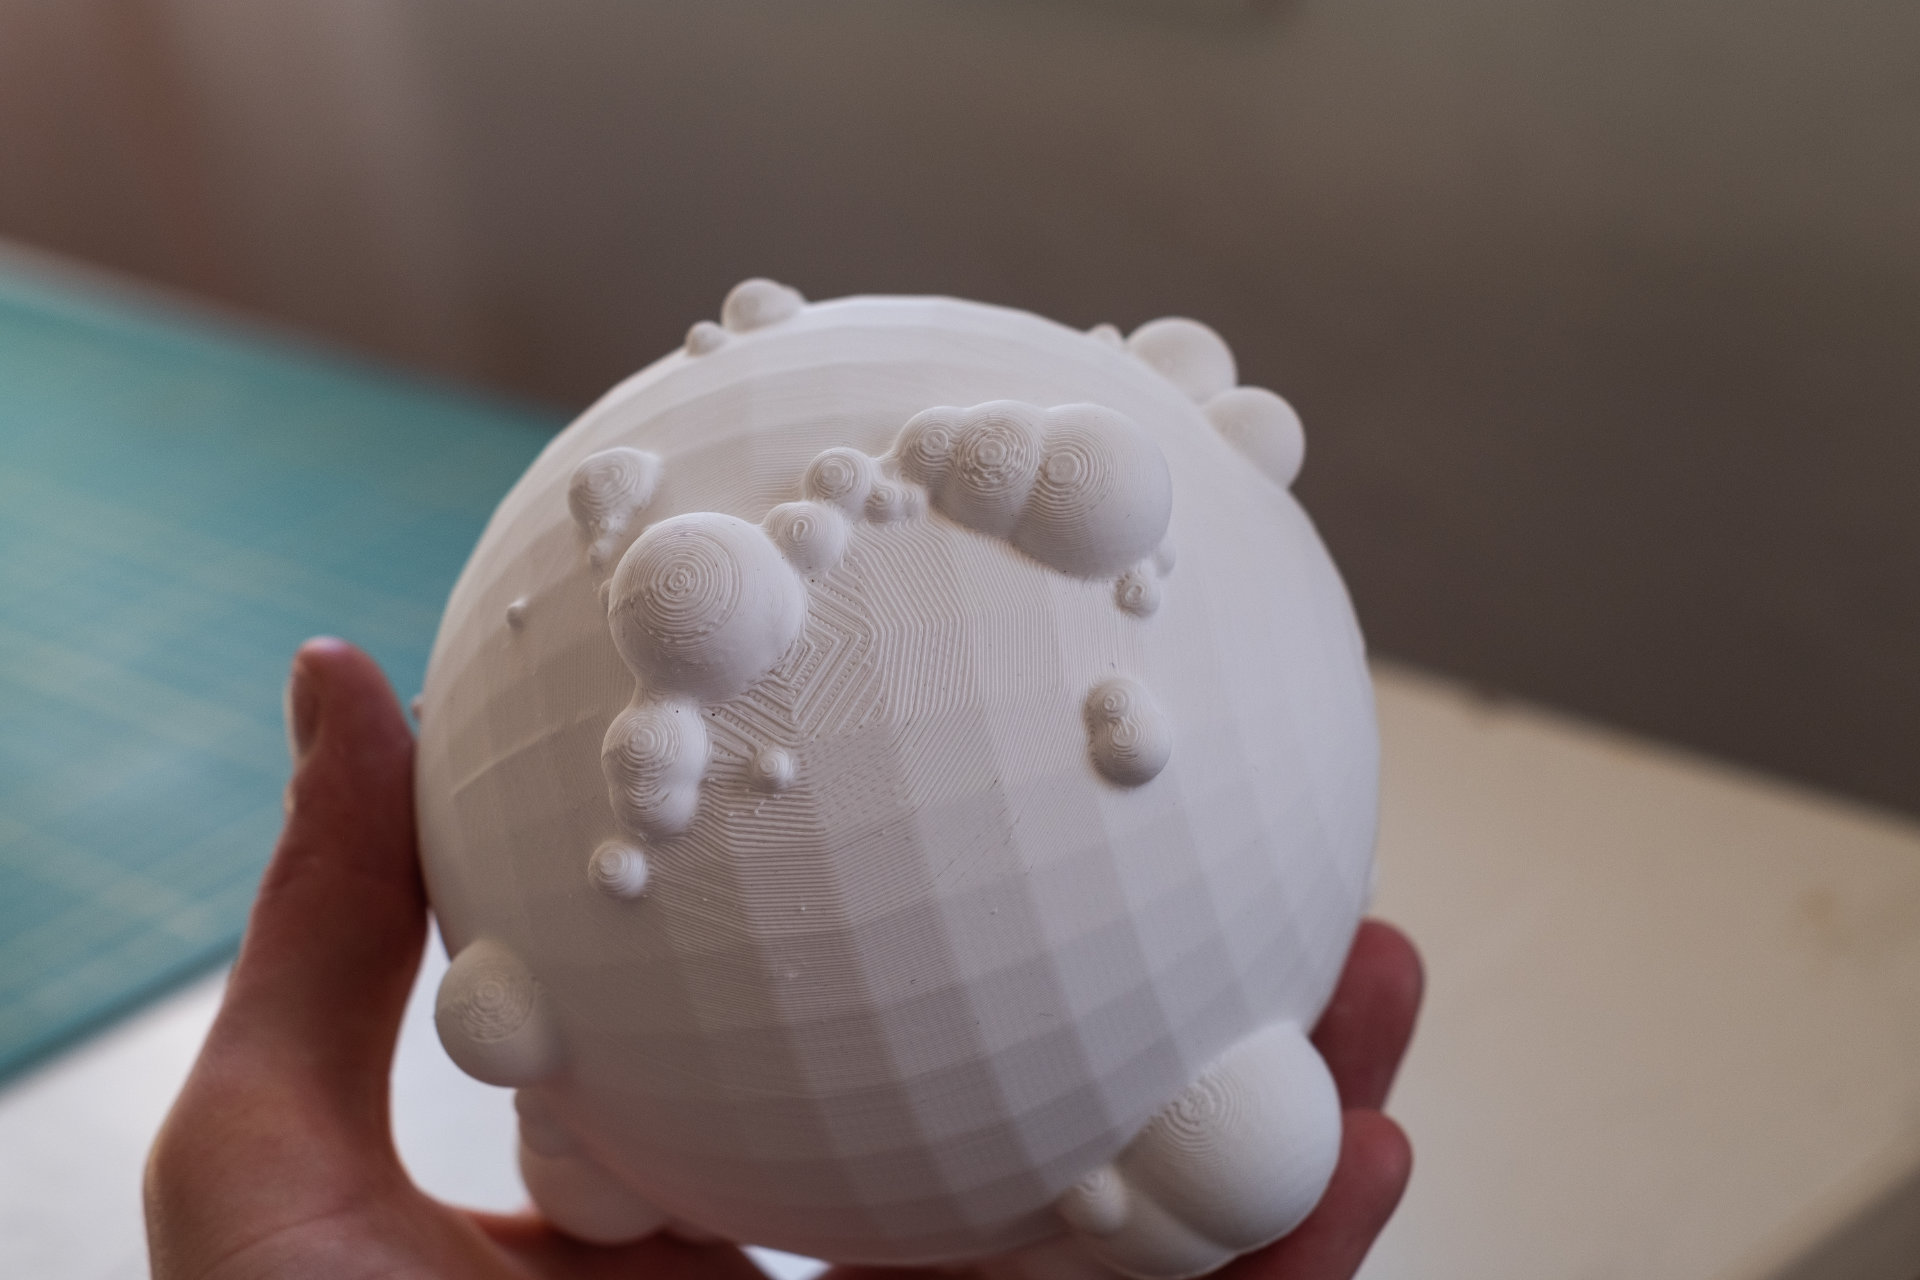
3D-printing earthquake data globe
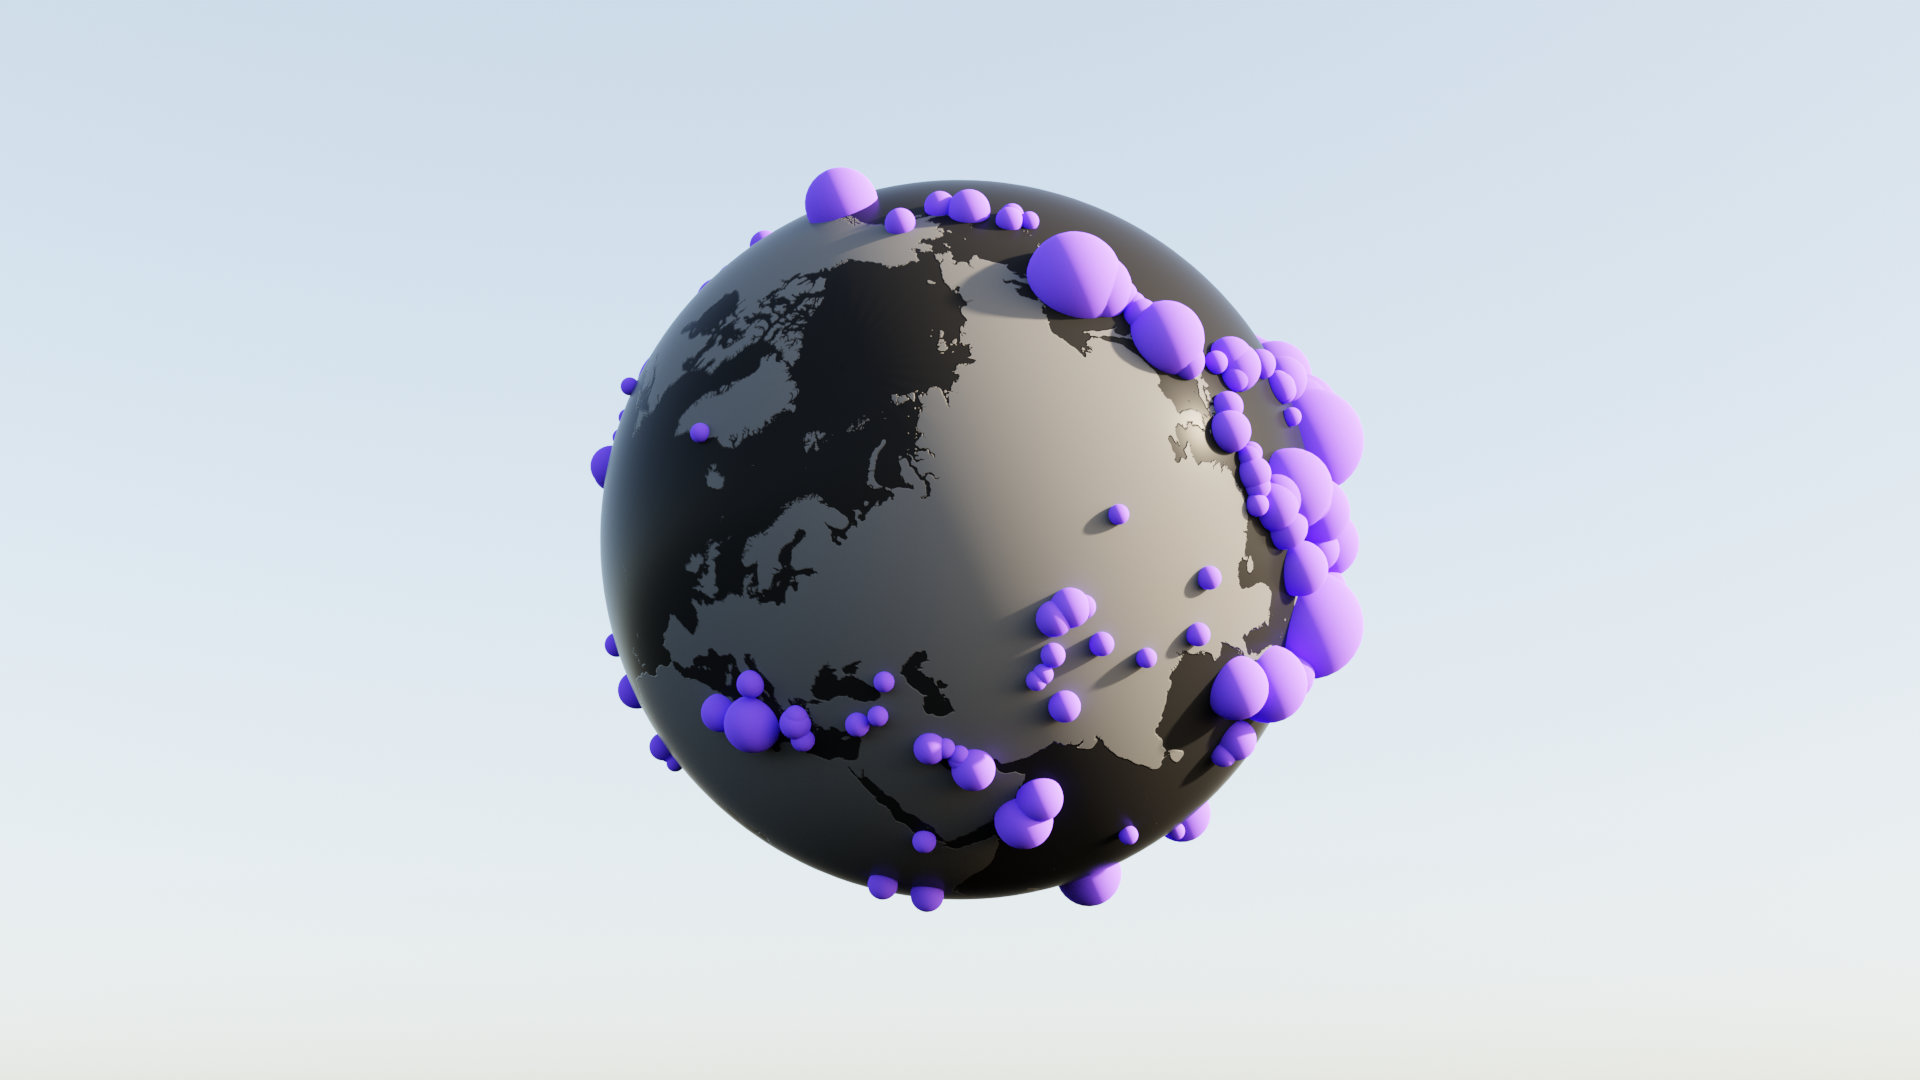
In the next step, I 3D-printed one of the globes to represent earthquake data. The model confirmed the benefits of physical data embodiment, offering easier, quicker, and more intuitive comprehension compared to its digital counterpart. In Addition, due to the absence of country contours, the model sparked curiosity among viewers, prompting them to explore continental and plate boundaries. Nevertheless, a limitation of the print was its inability to display dynamic data, given its static nature.
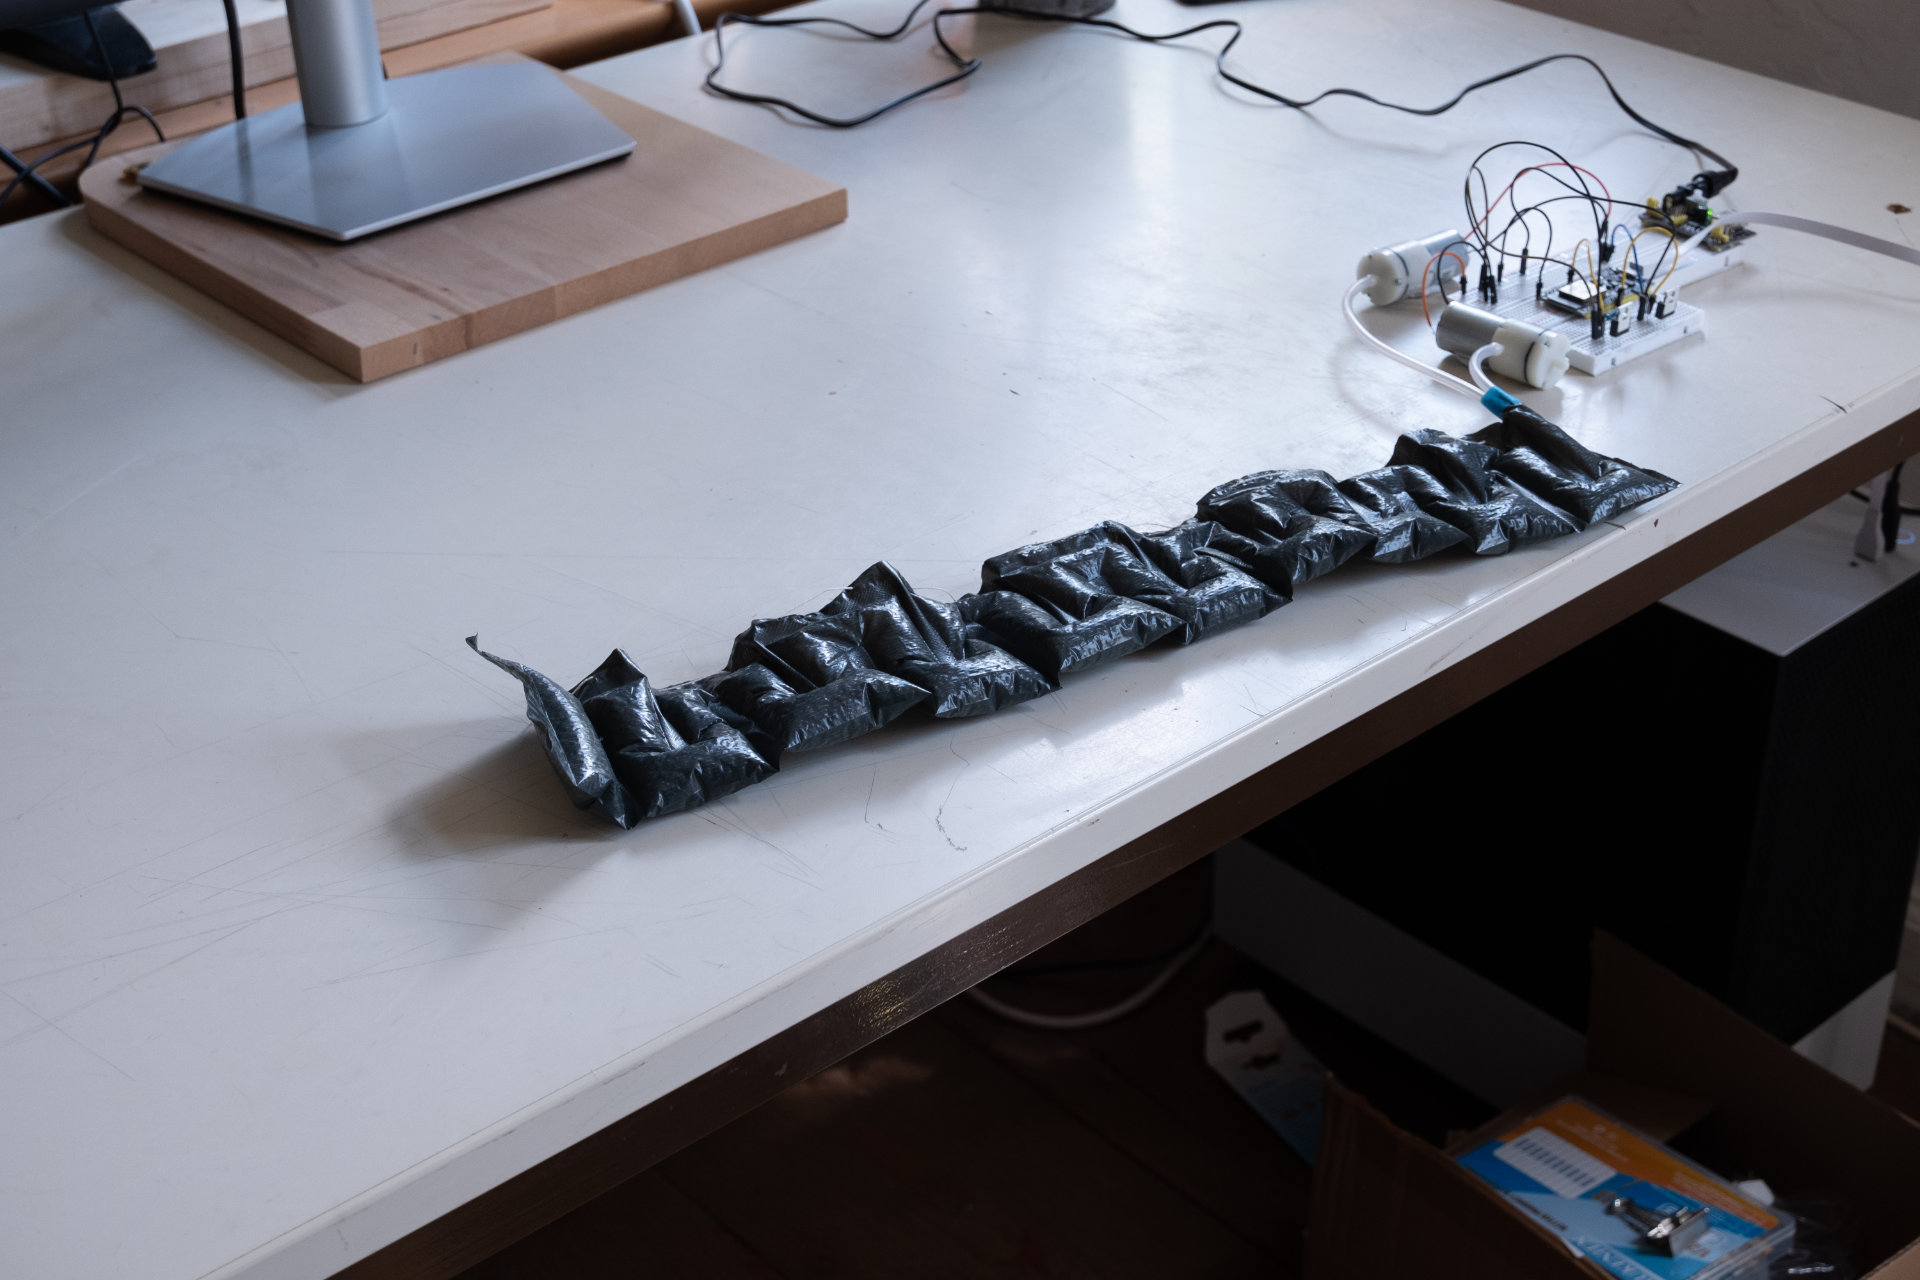
Dynamic data prototyping
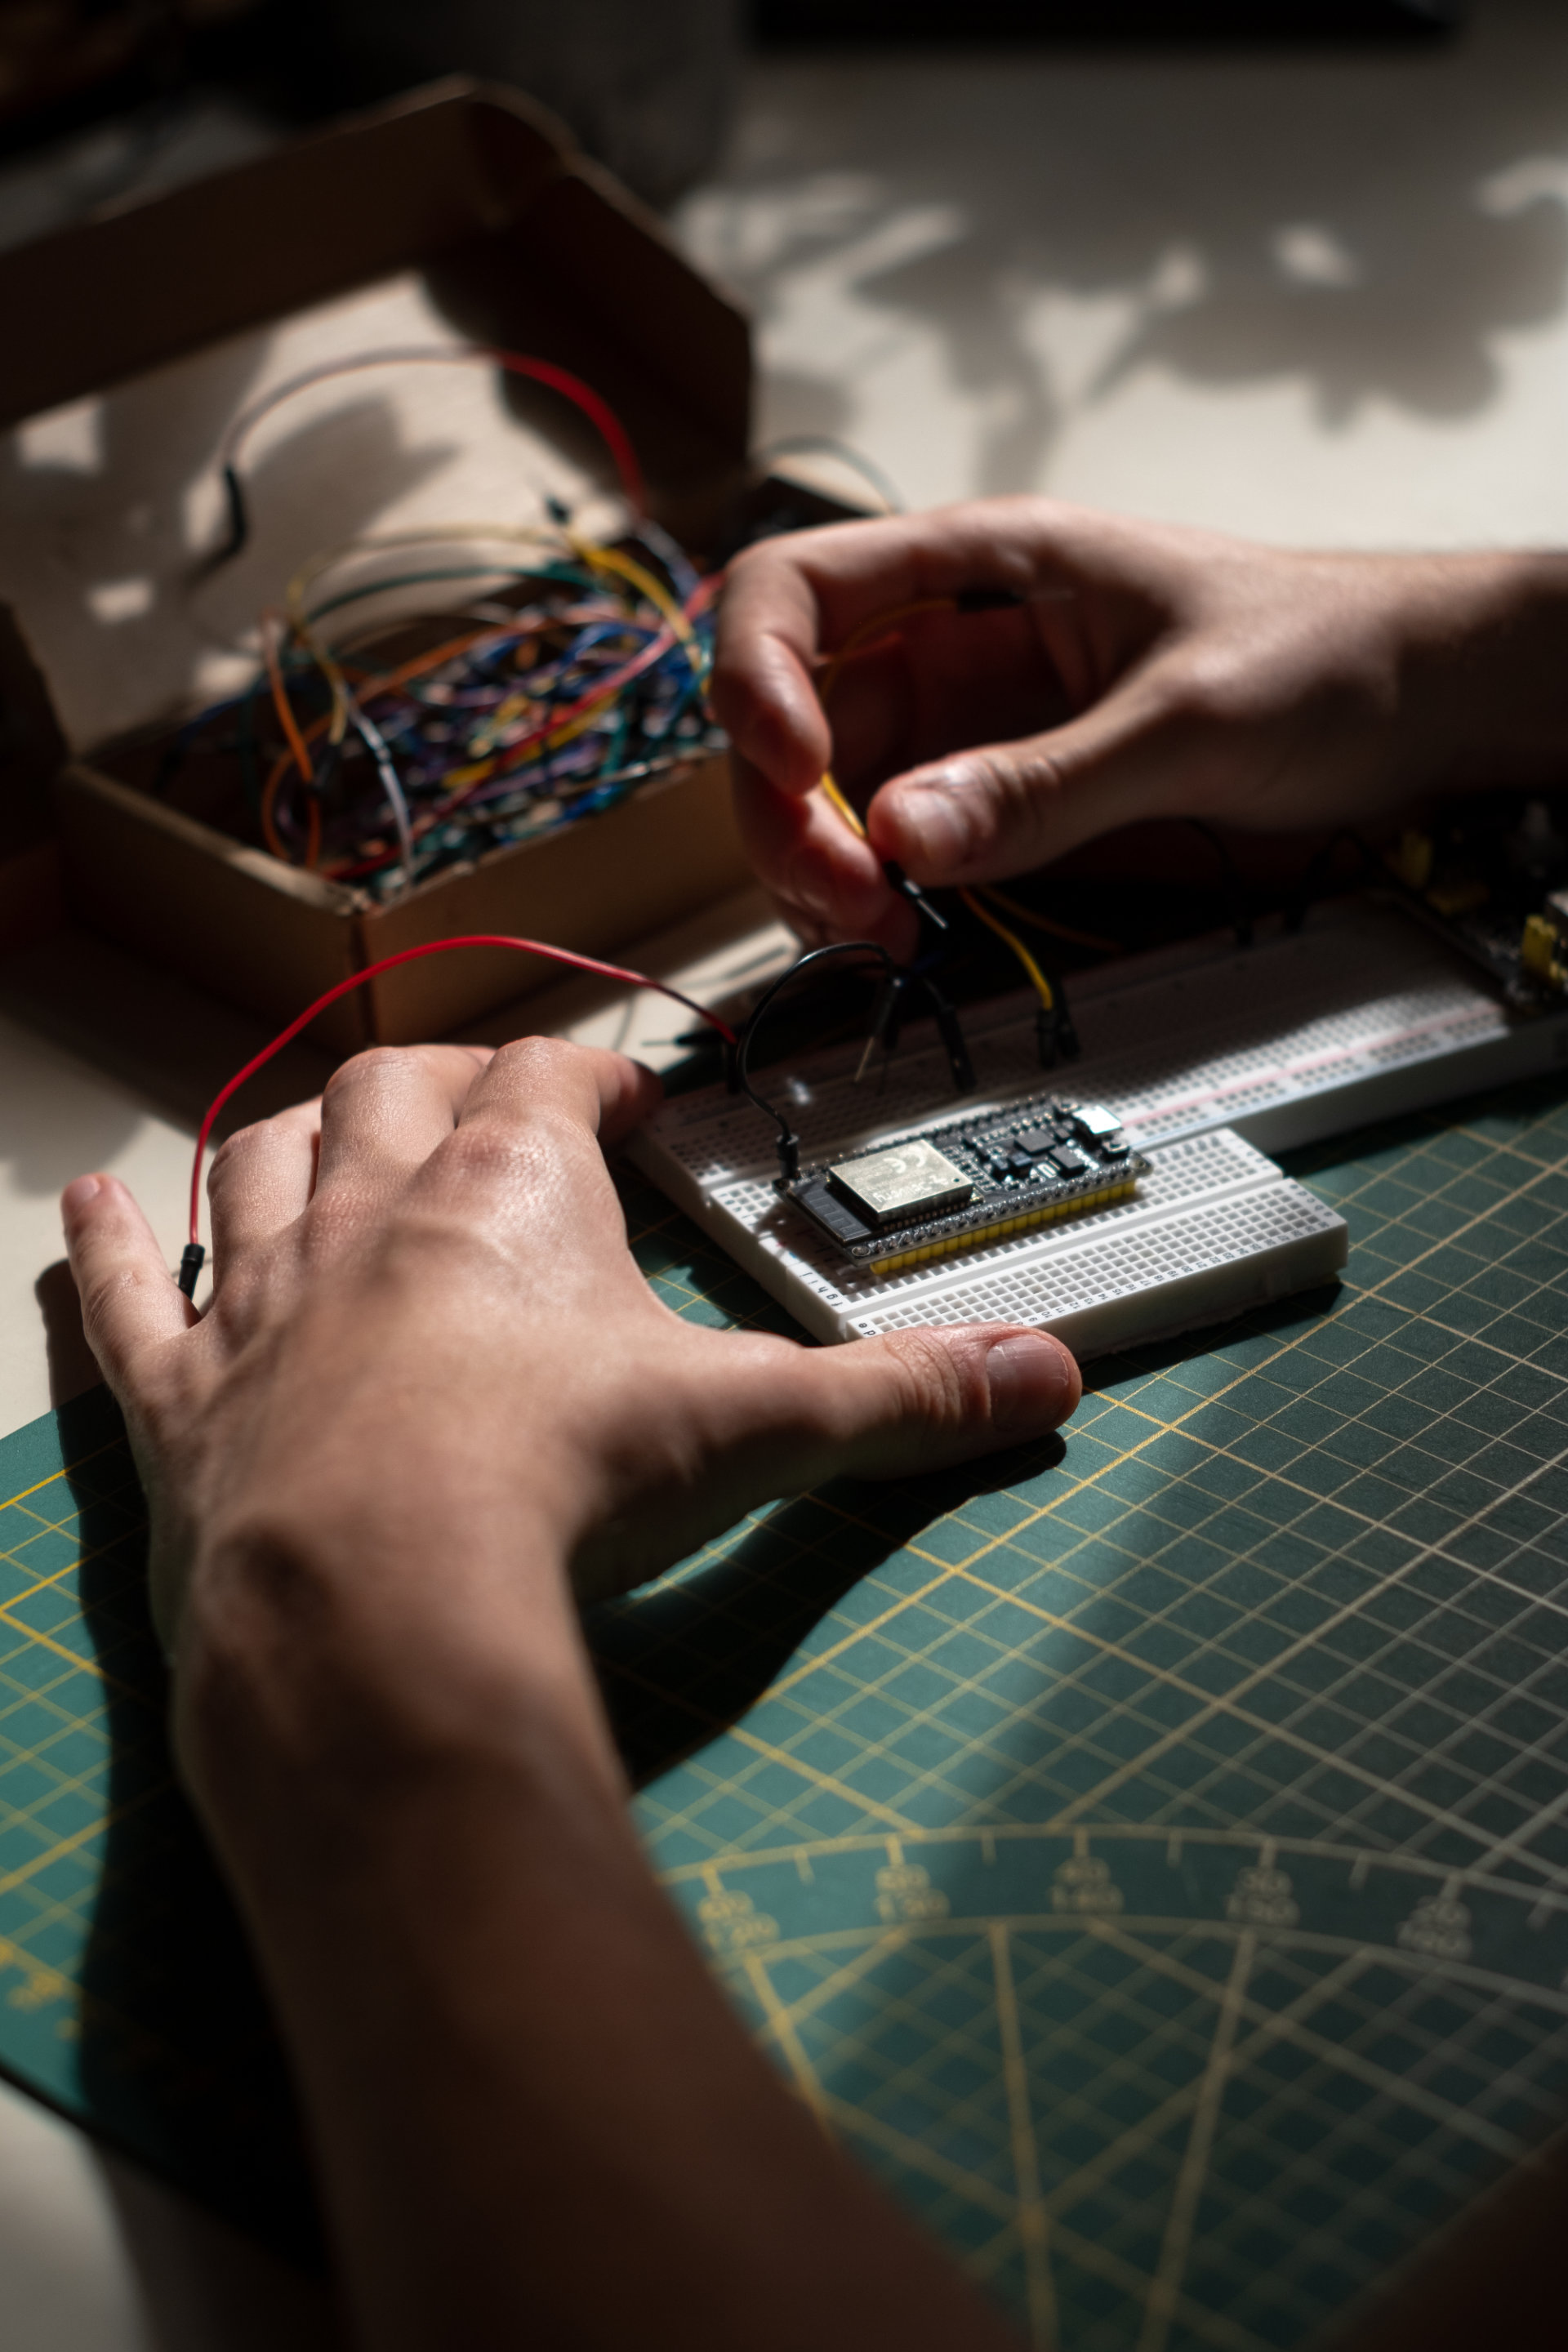
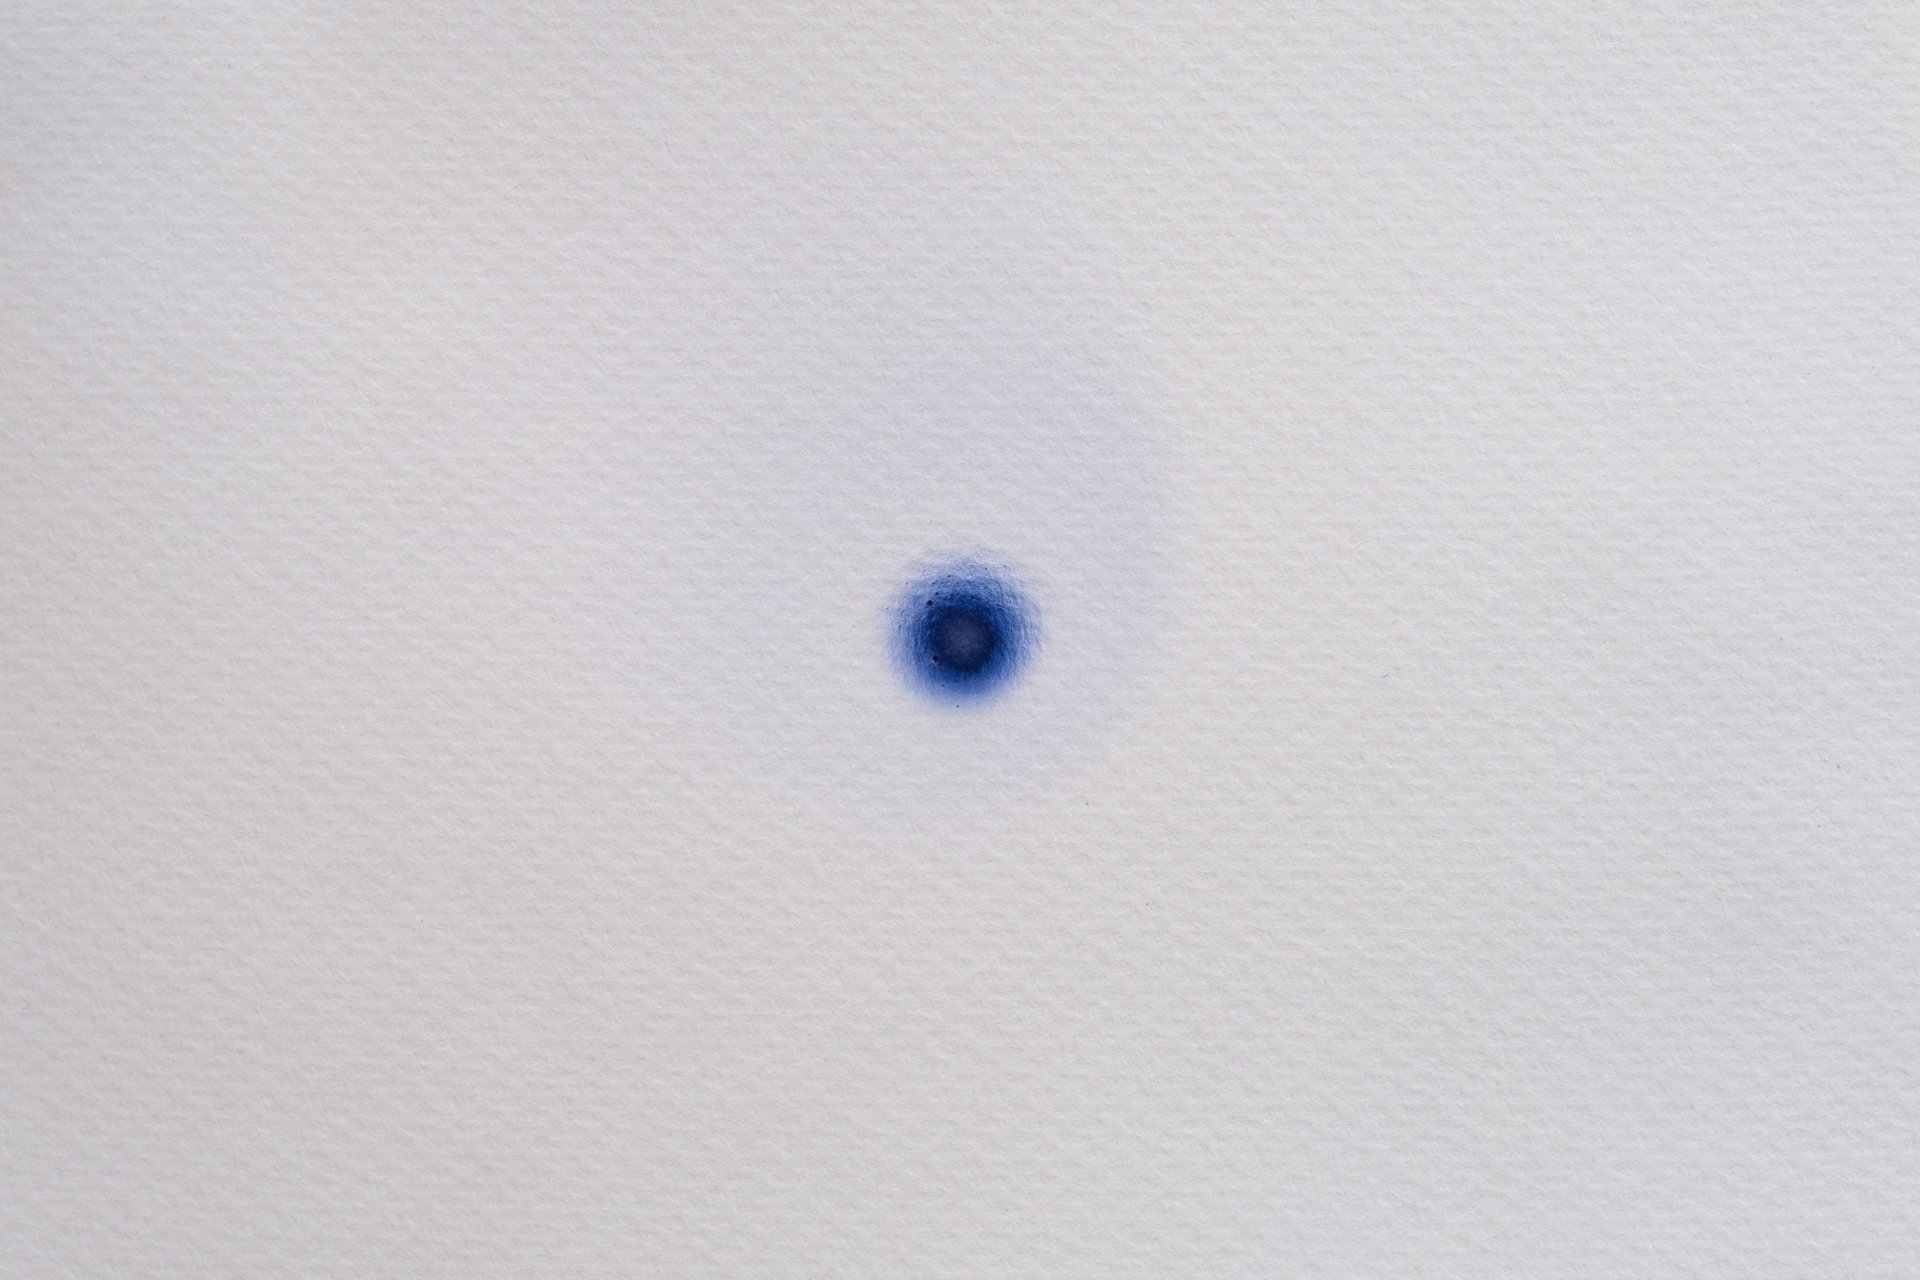
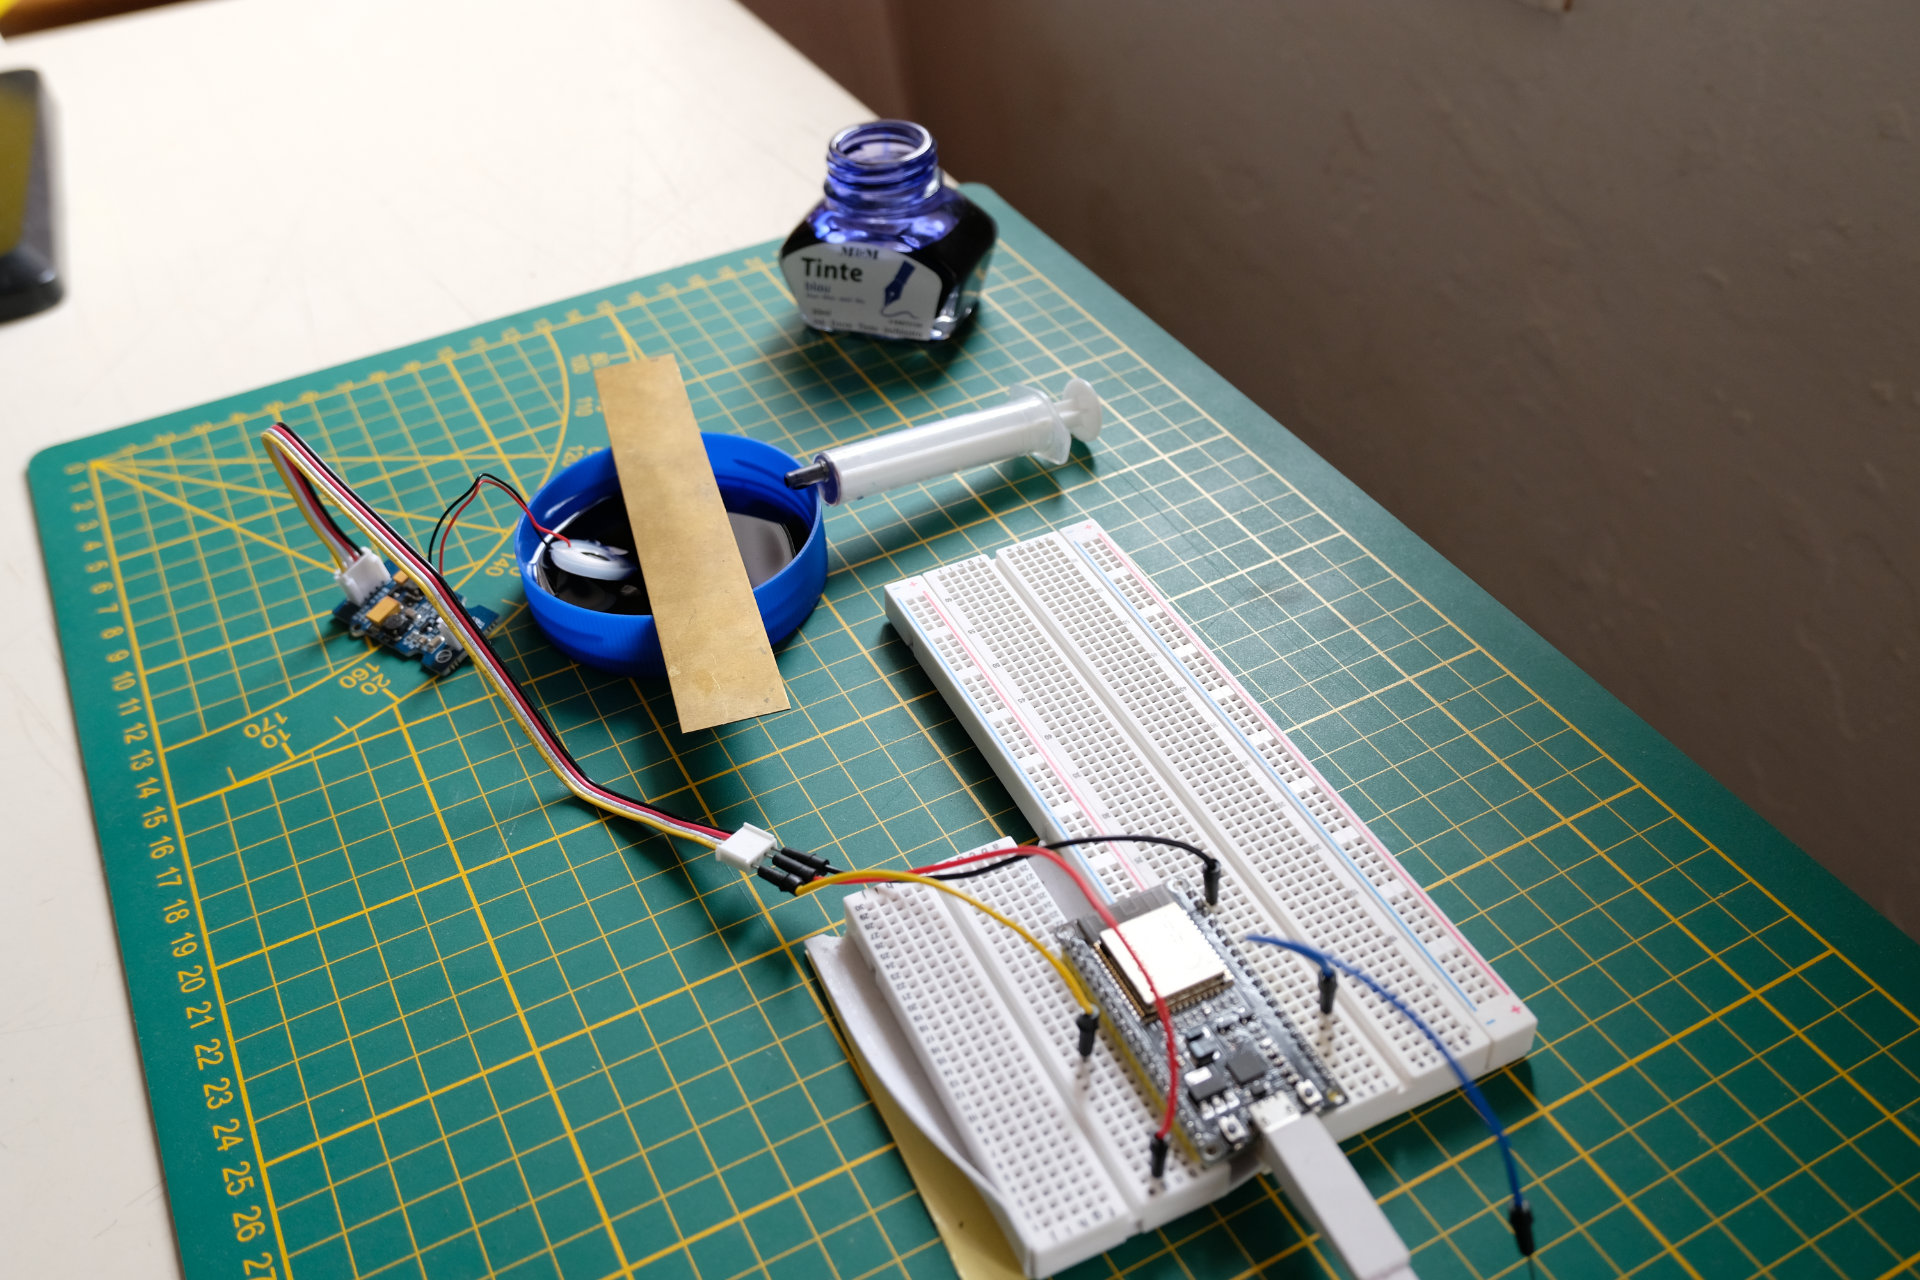
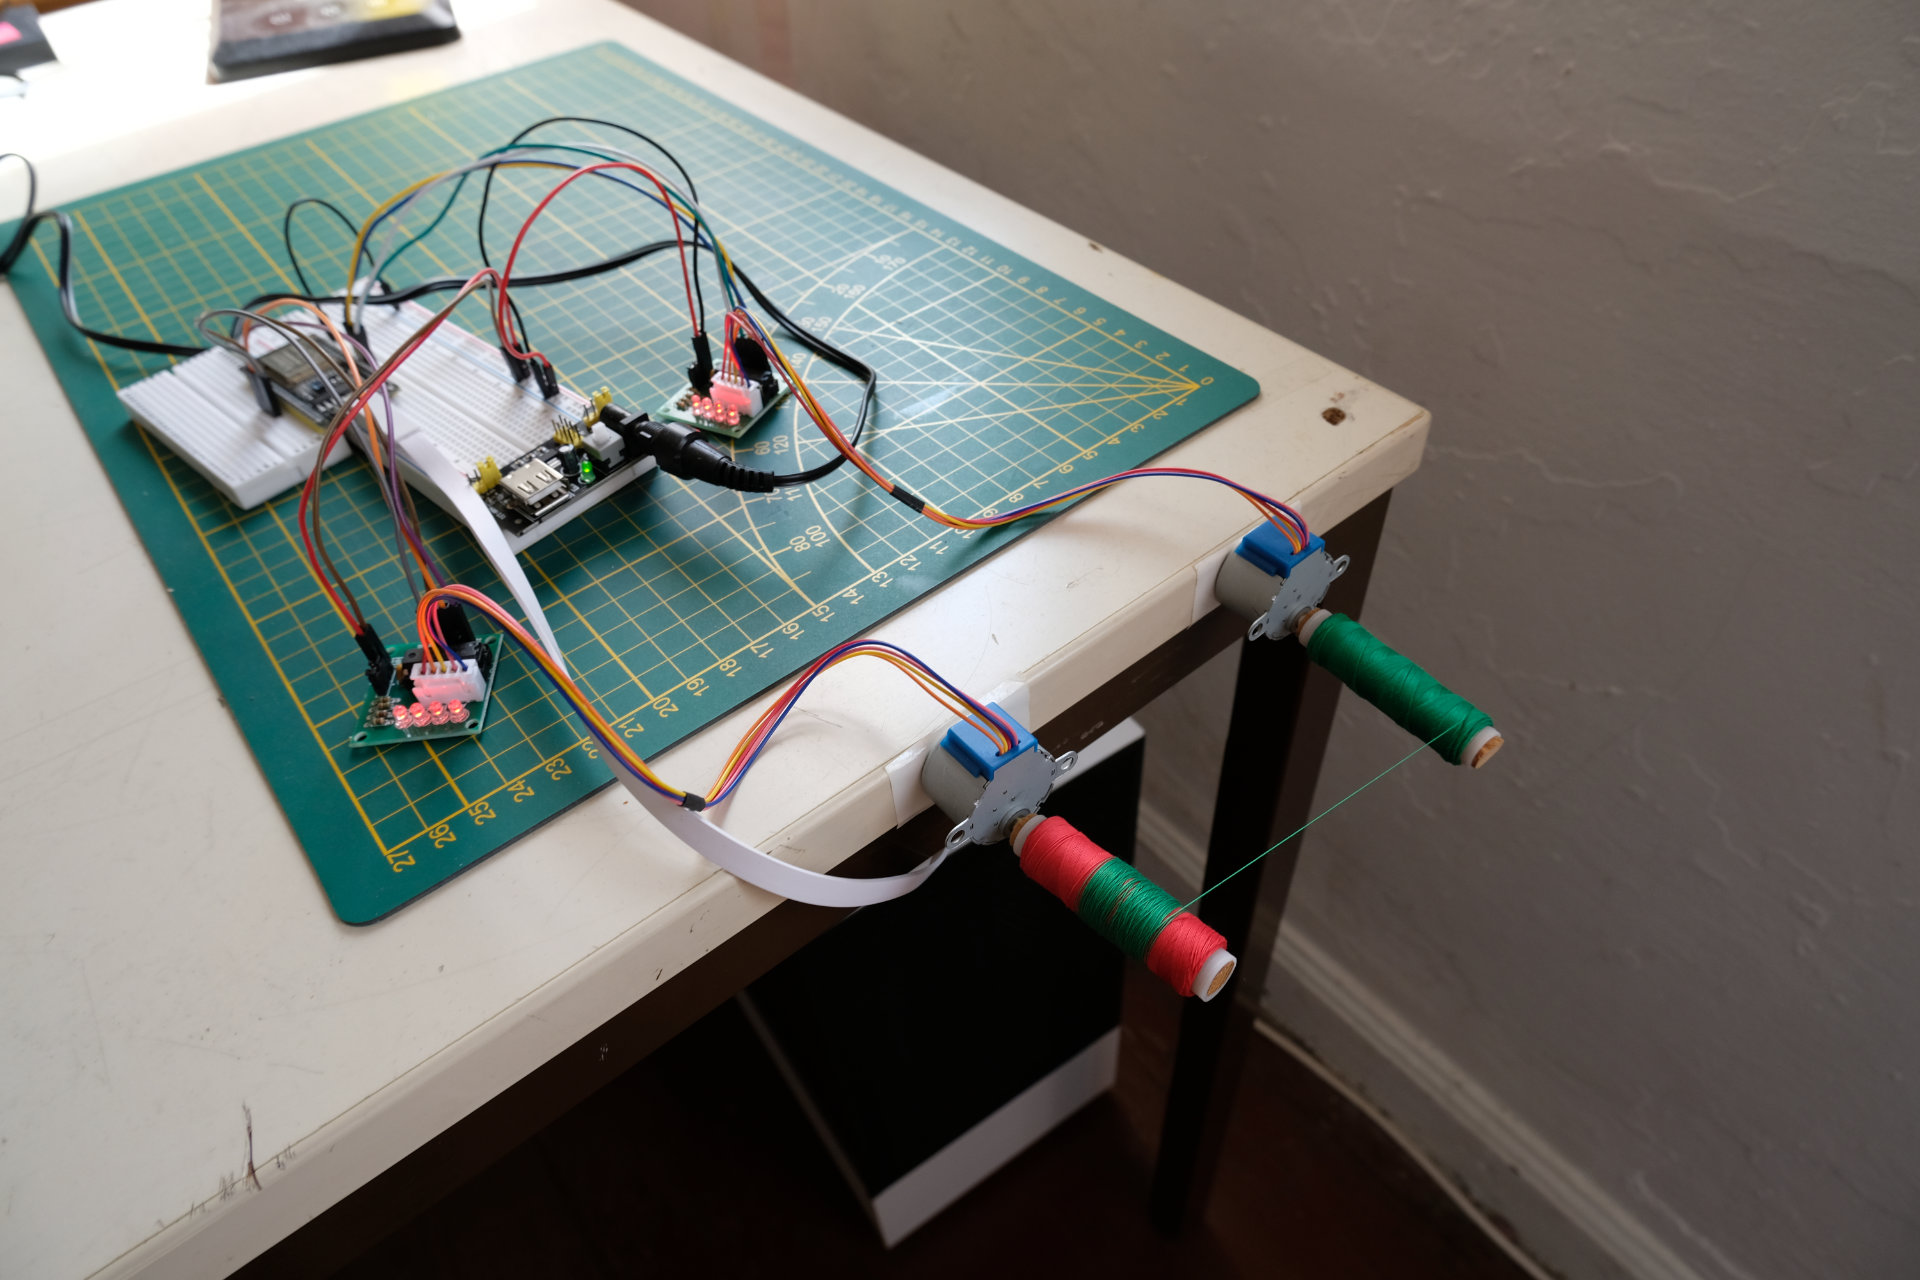
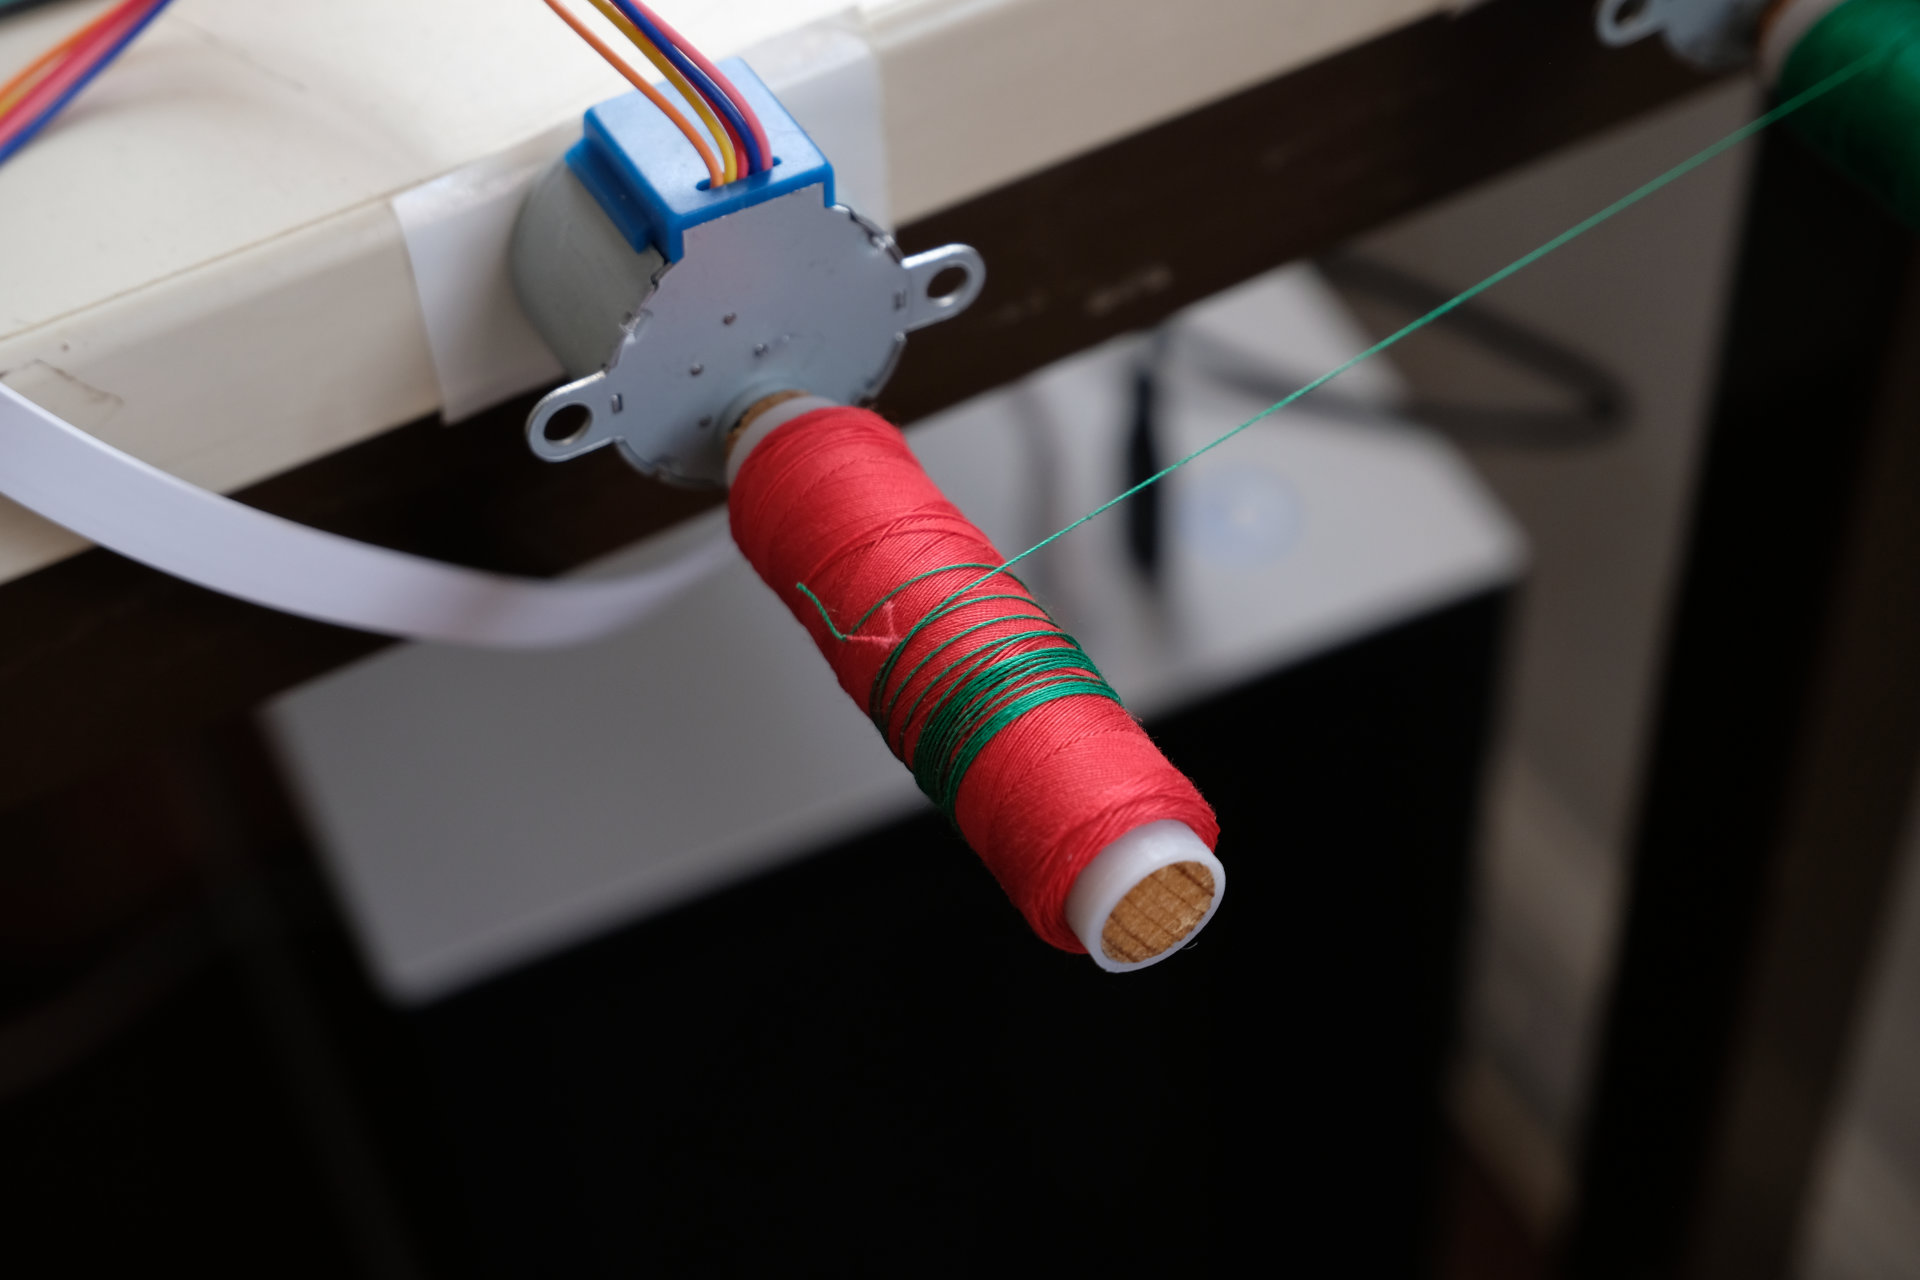
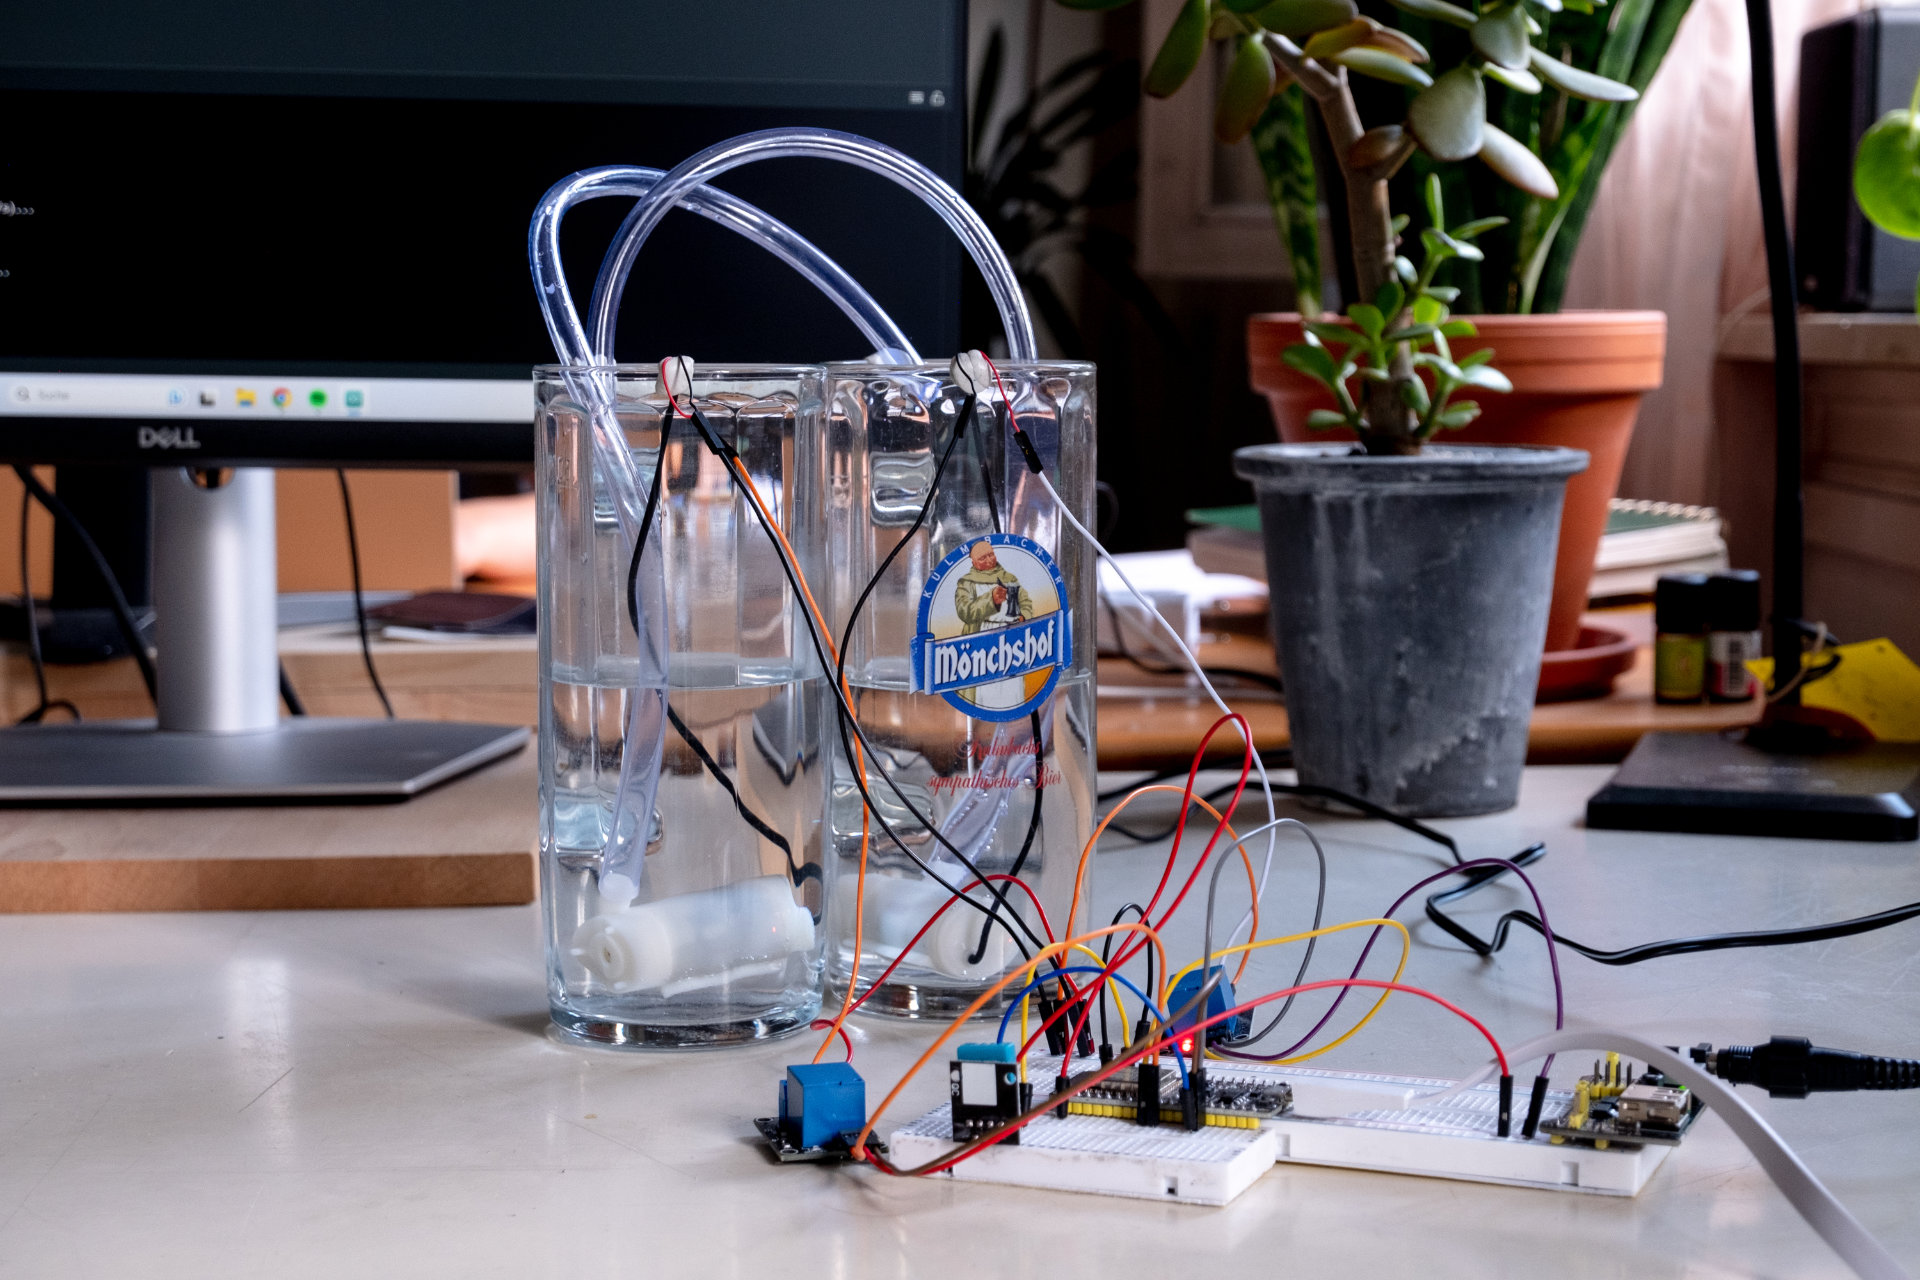
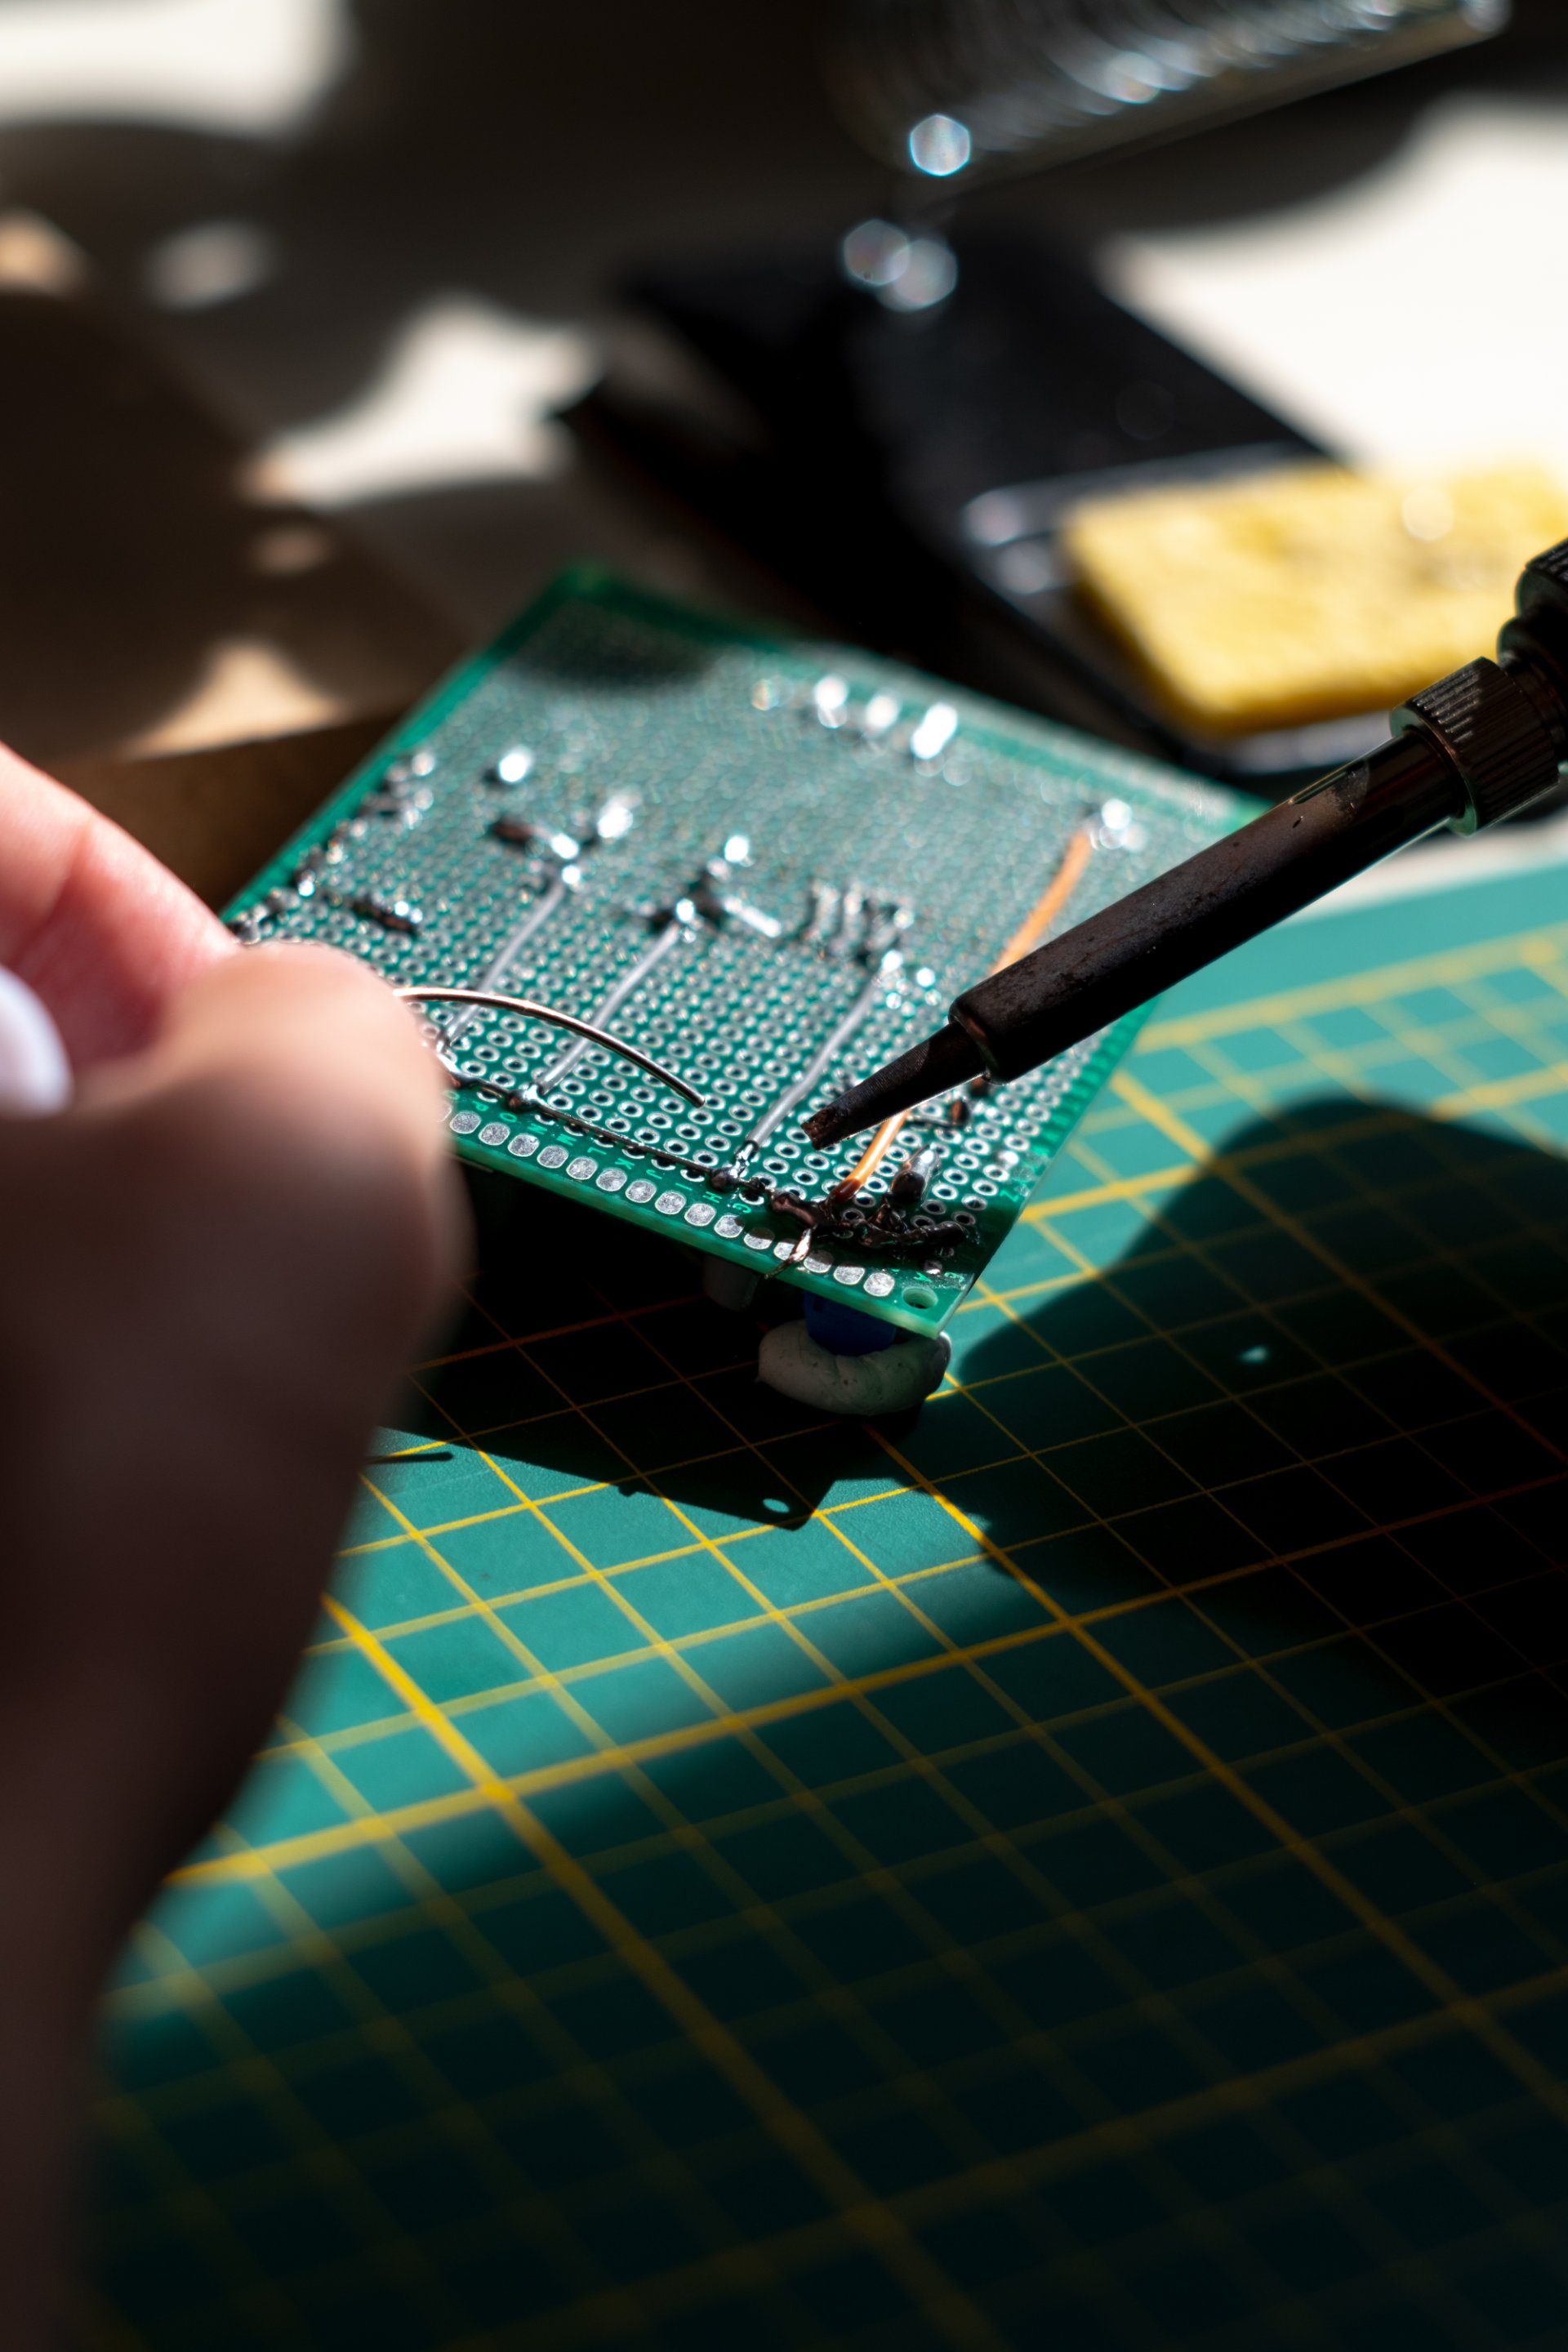
Recognizing the prevalence of dynamic data in our surroundings, I focused on embodying dynamic data in the following experiments. I tested four actuators – atomization modules, vacuum pumps, submersible pumps, and stepper motors – to assess their characteristics and potential applications. This involved using an ESP-32 microcontroller, various sensors, and APIs to fetch live data from the web.
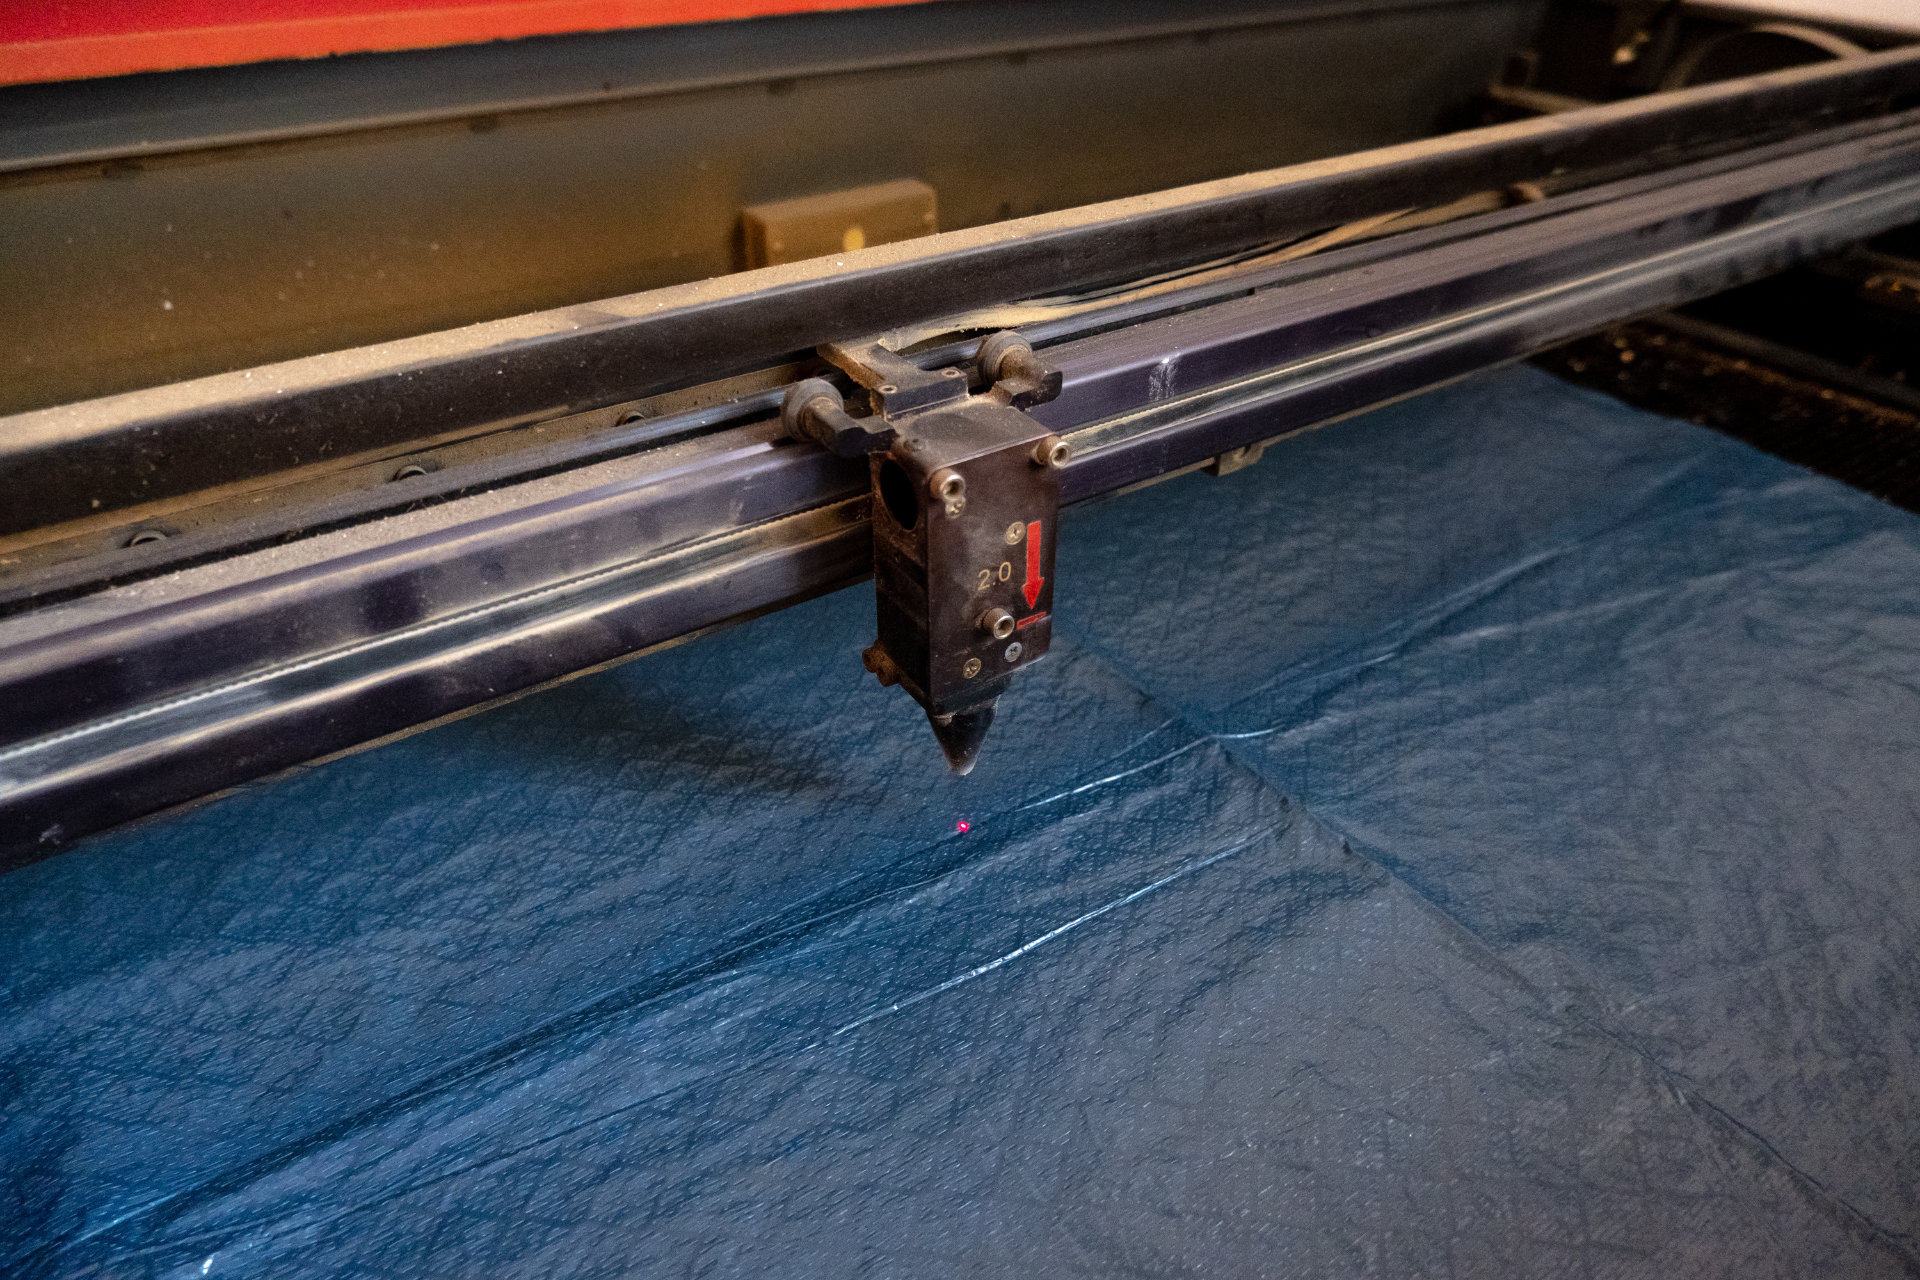
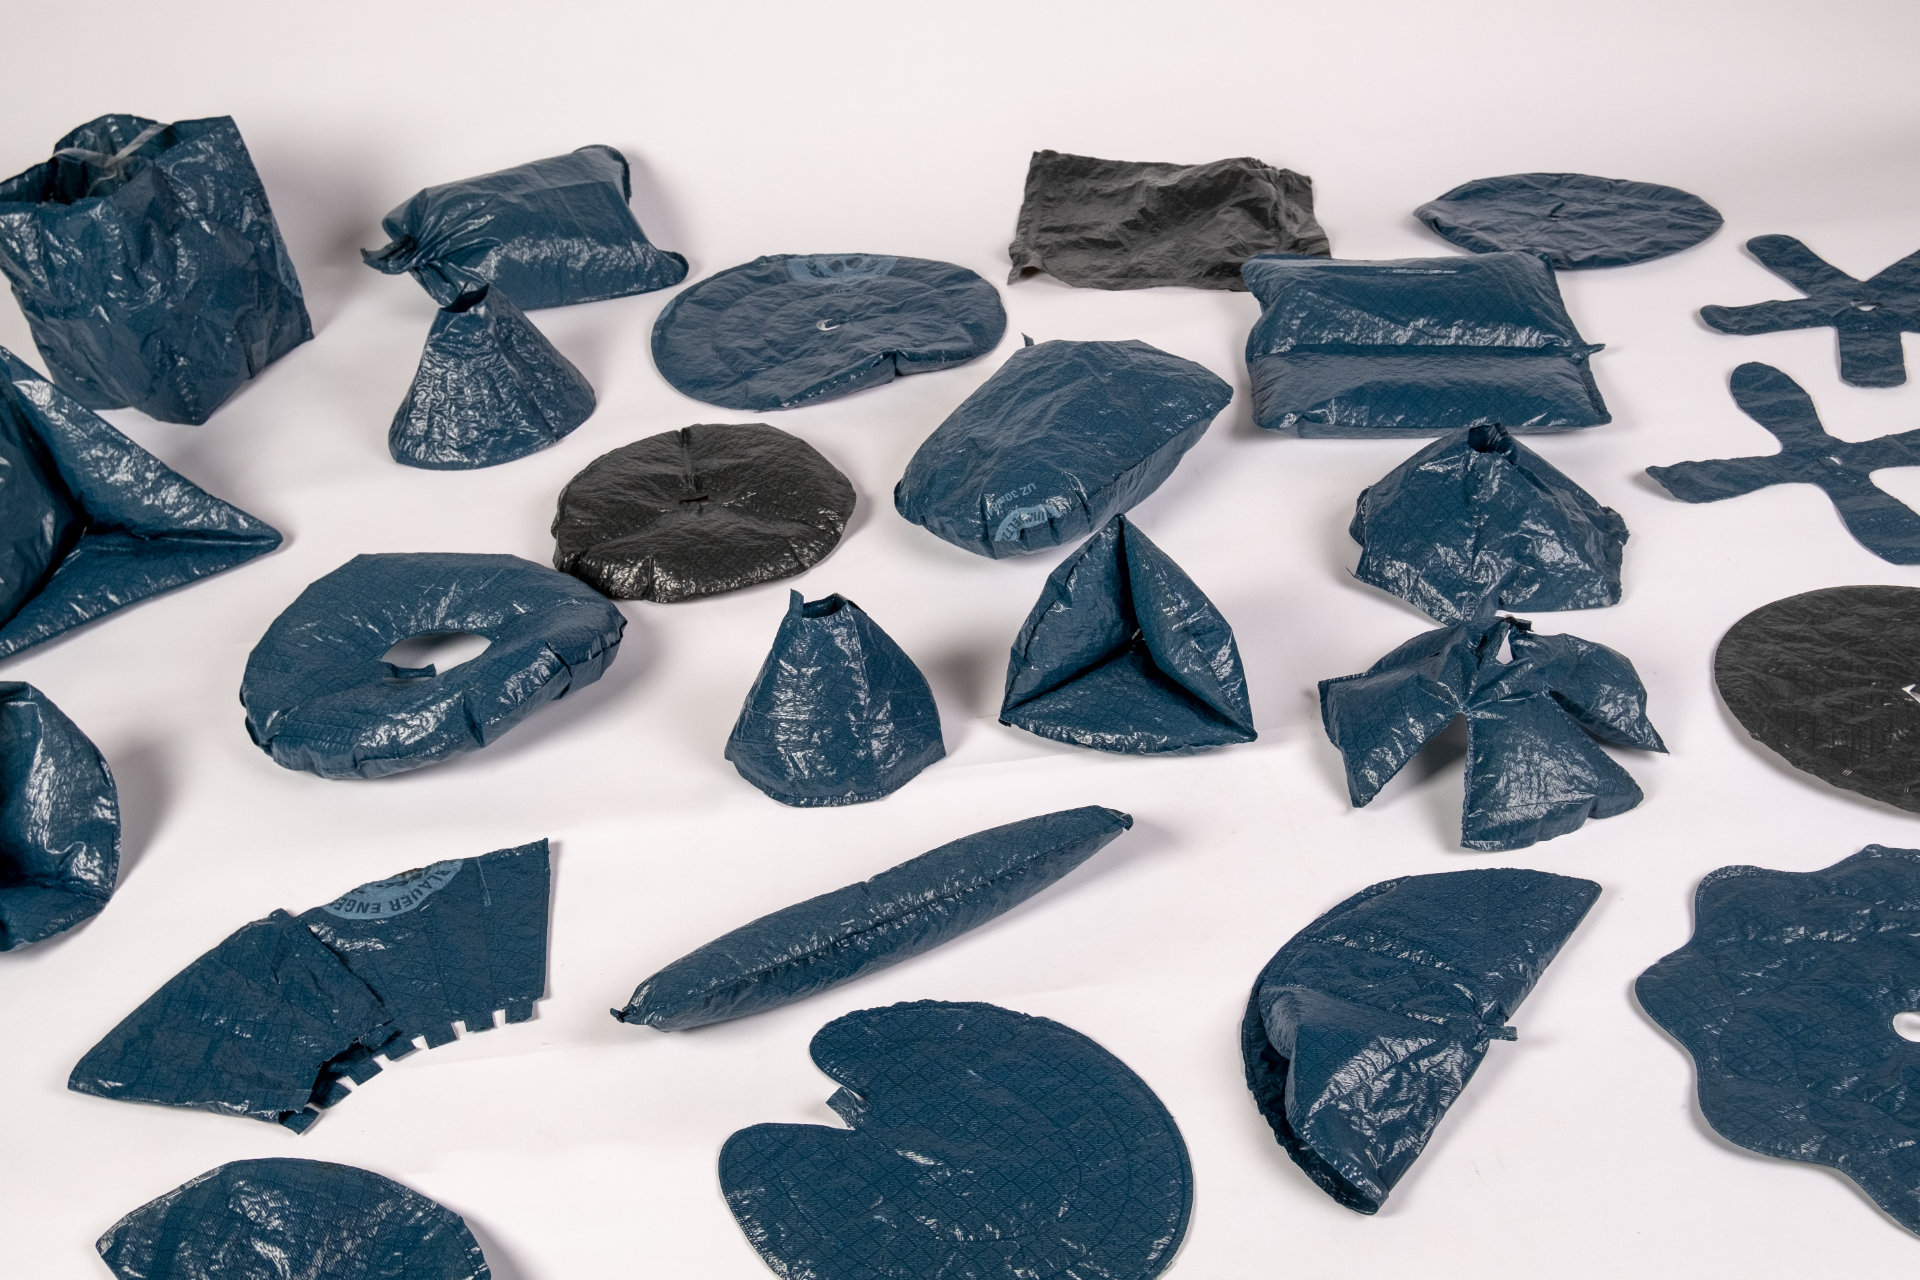
Concept elaboration
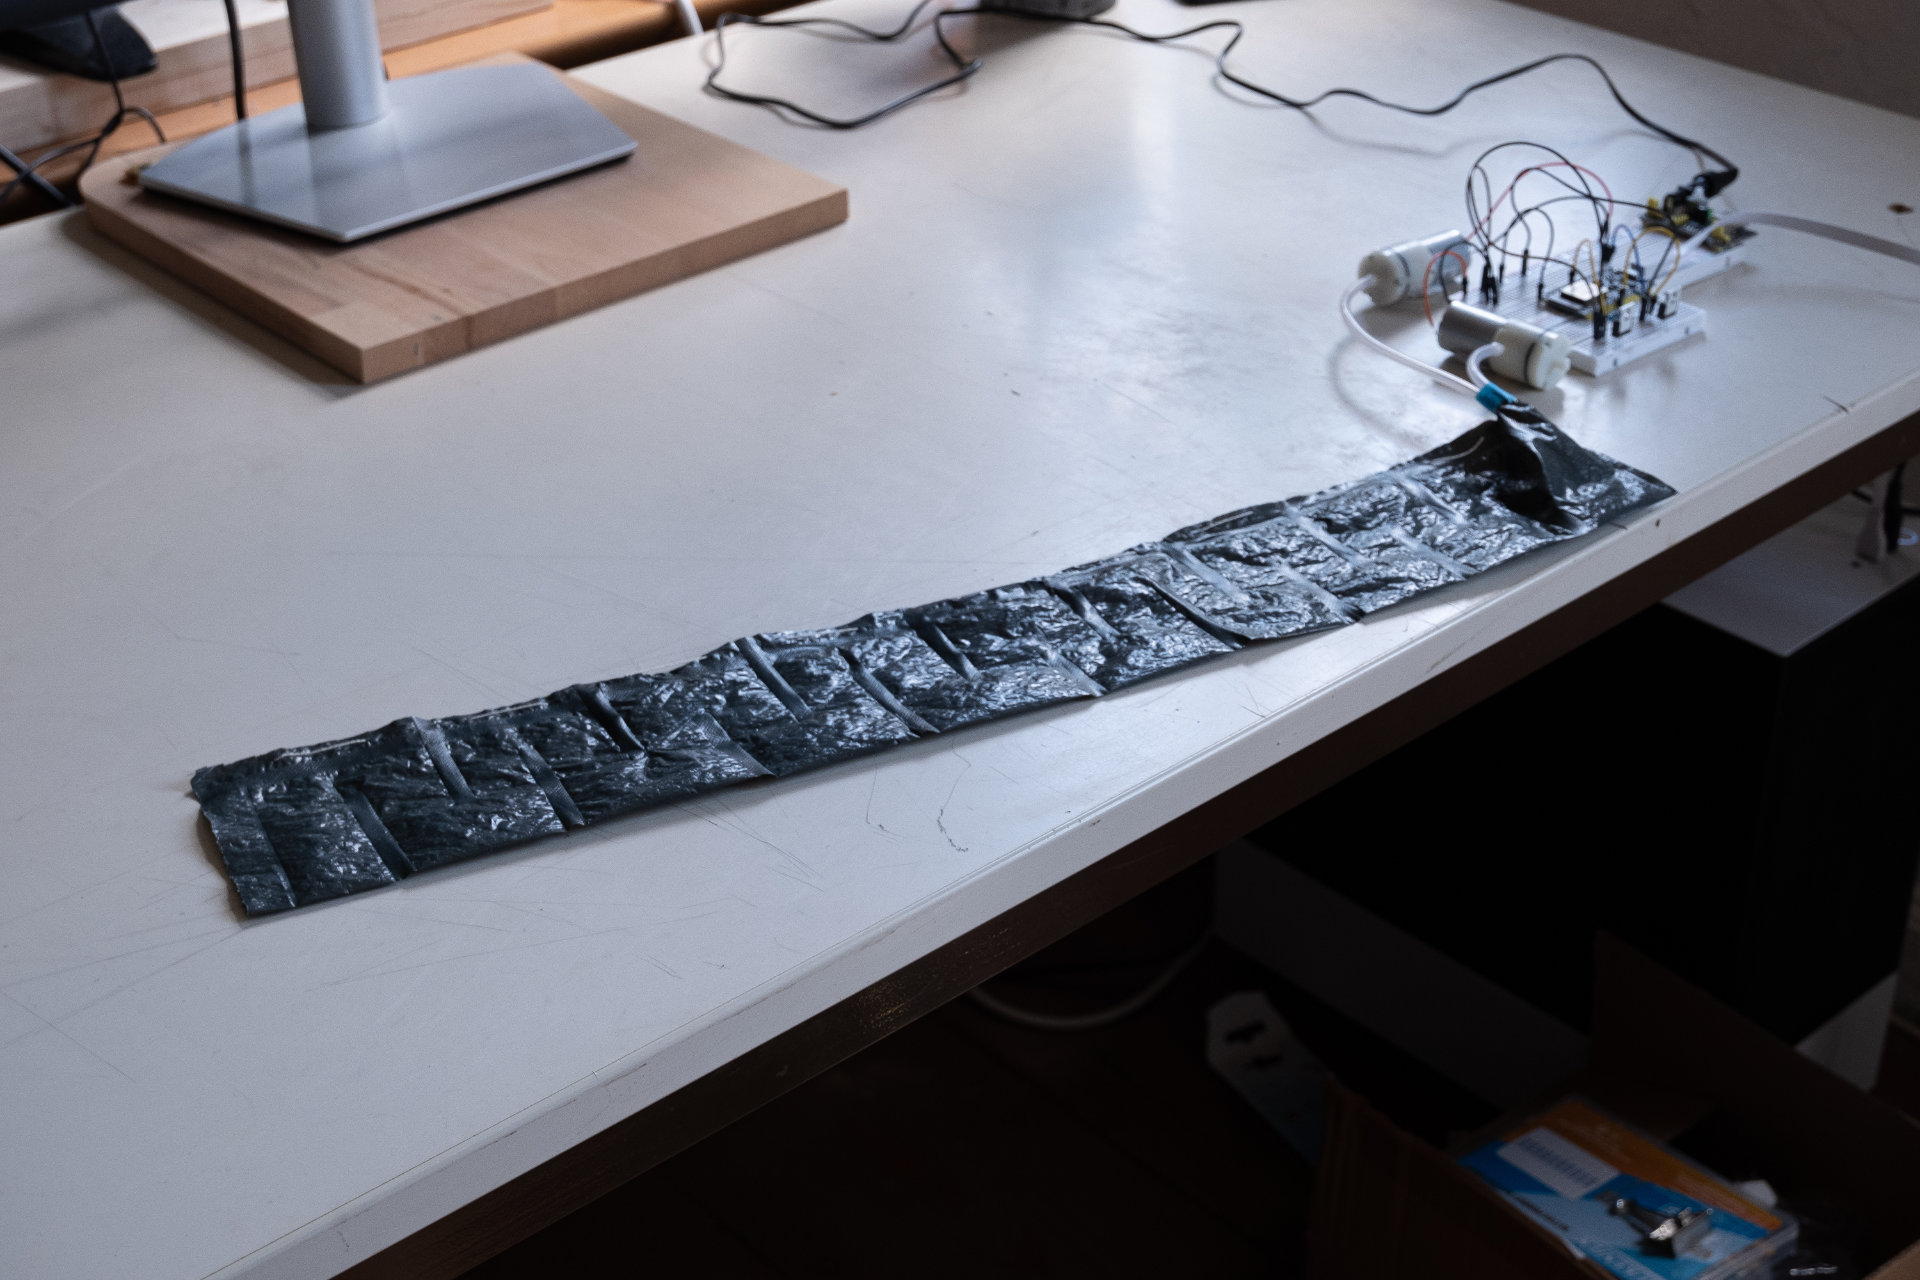
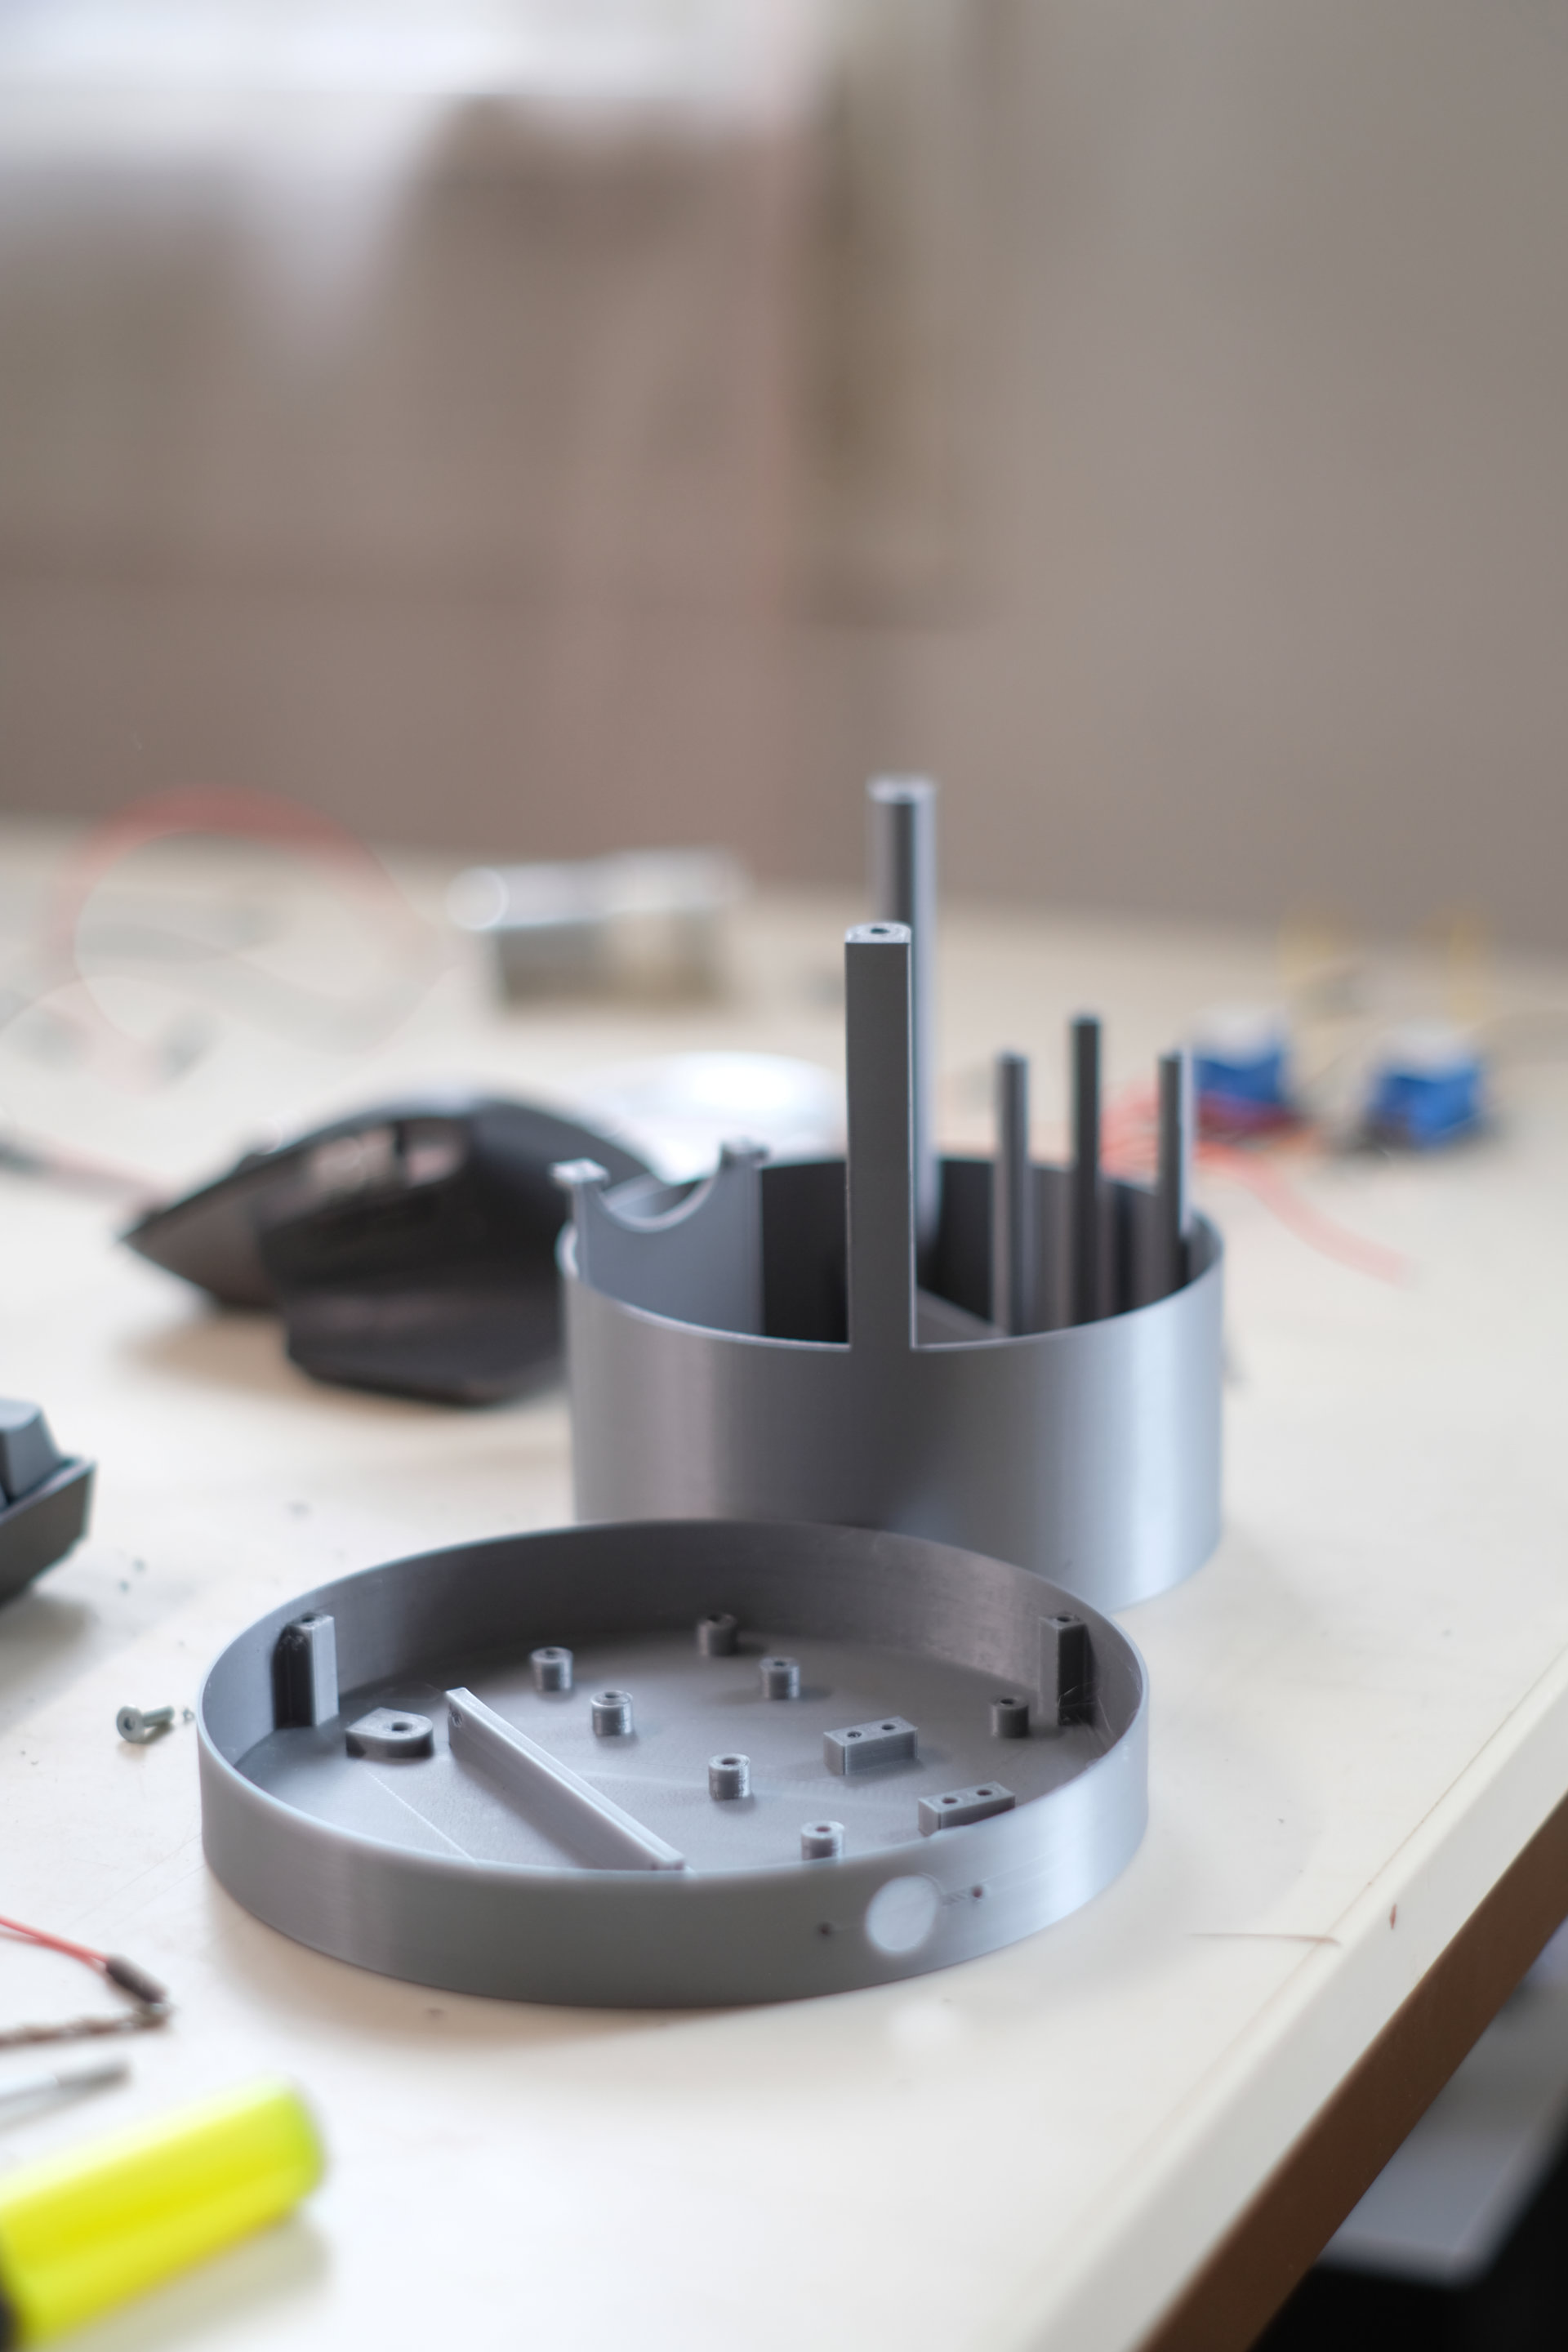
Building on my experiments, I aimed to elaborate on one of the actuation prototypes in a specific application design. To achieve this, I searched for analogies, created additional prototypes and developed a concept for a dynamic light object.
Software development
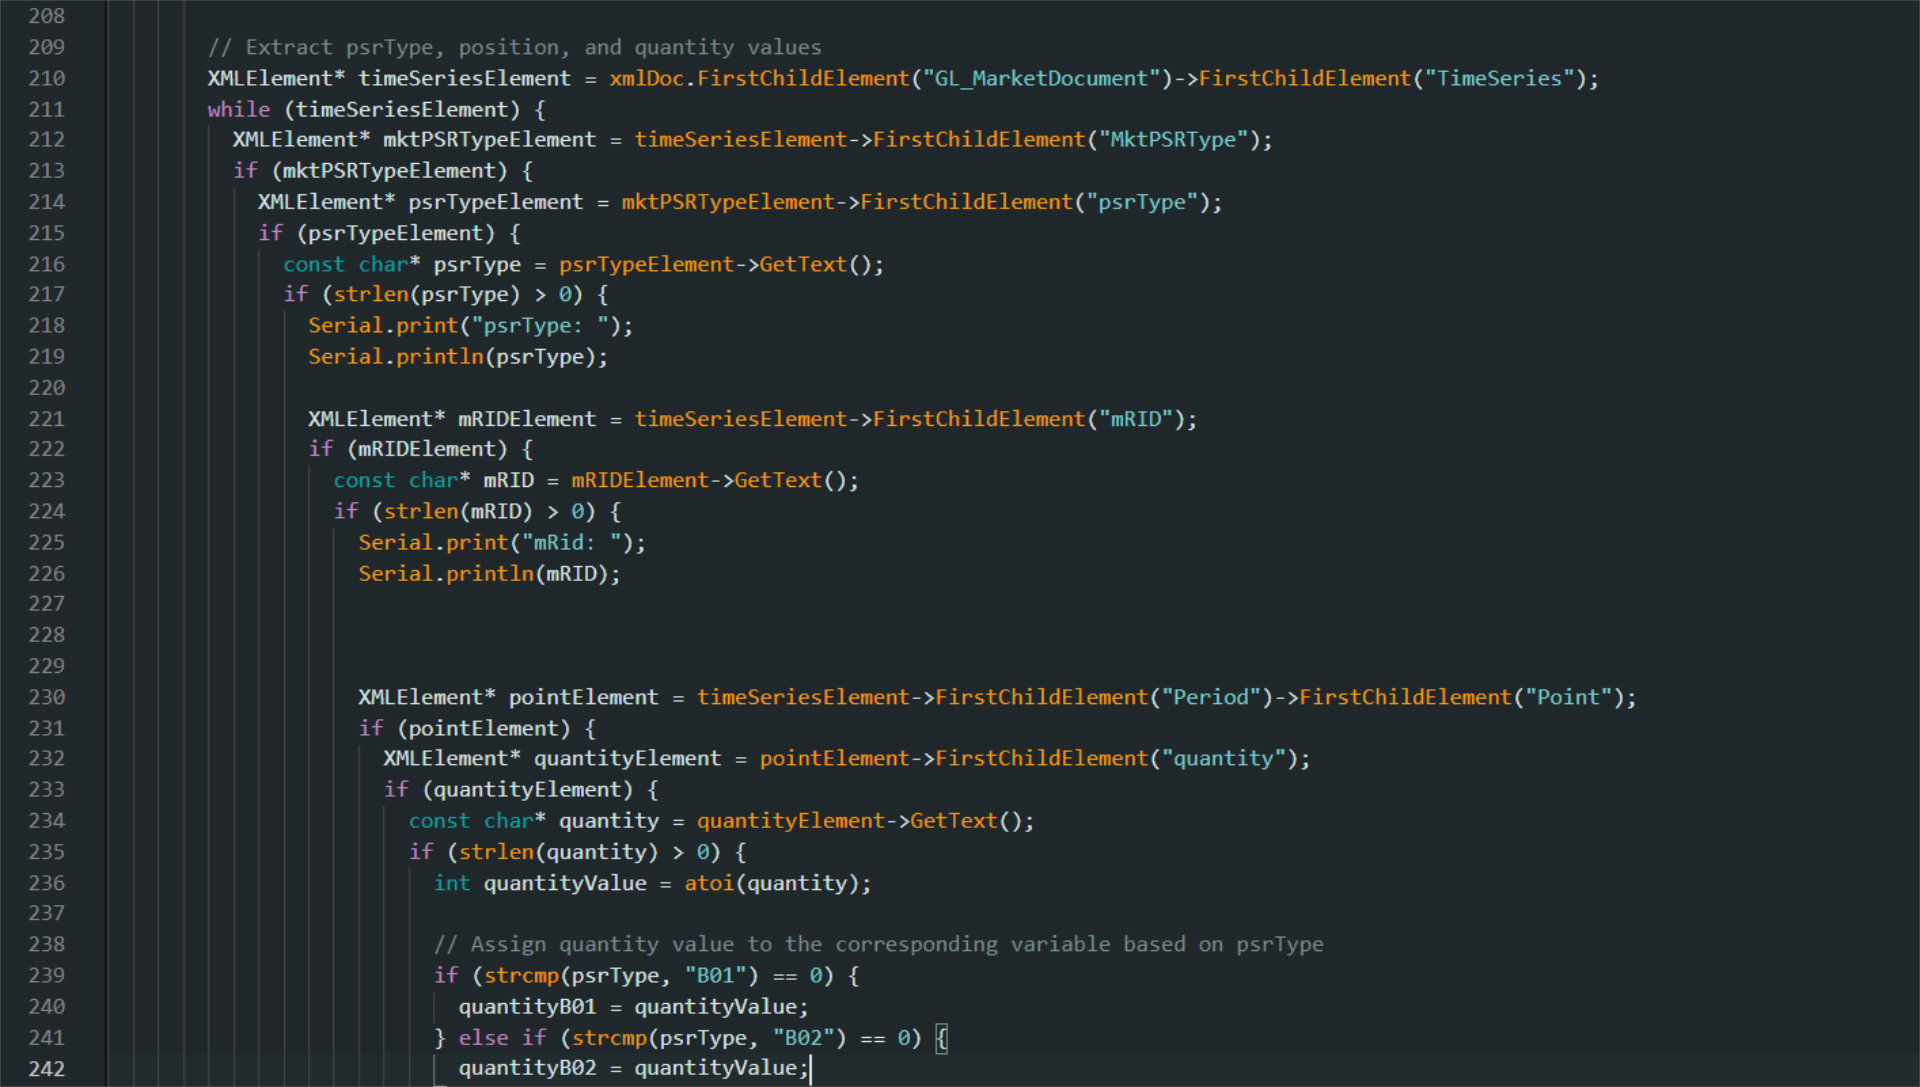
To create a functional prototype, obtaining reliable energy generation data was paramount. Leveraging ENTSO-E, the European Network of Transmission System Operators for Electricity, and utilizing their API, proved instrumental. The prototype relies on a dataset detailing net power generation, calculated from the fluctuating power mix influenced by weather and time of day. Processing this data involves making API requests to ENTSO-E, receiving XML-formatted documents, extracting required values, calculating the share of renewable energy, and finally, controlling the lamp's pumps and valves accordingly.
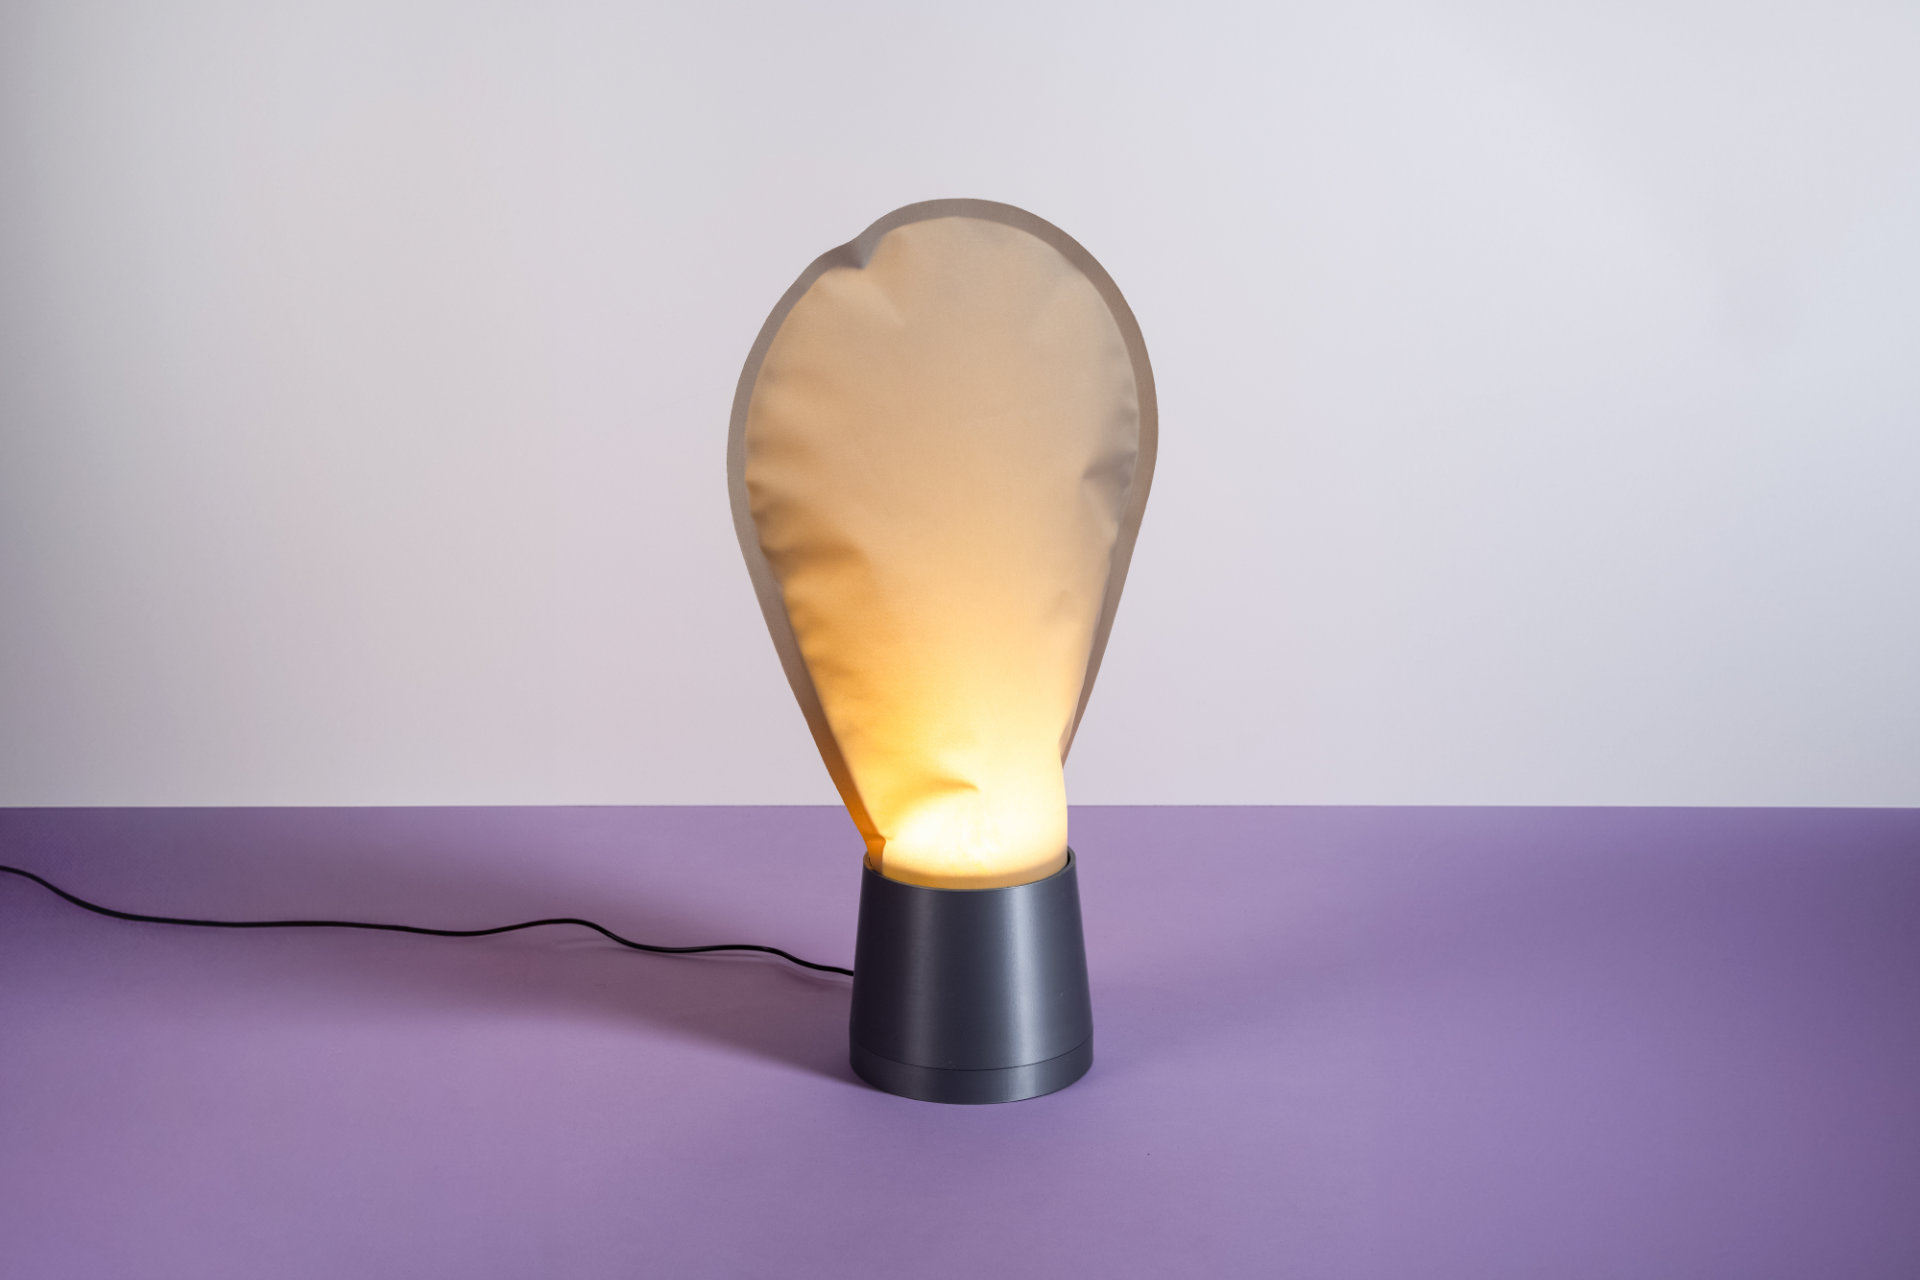
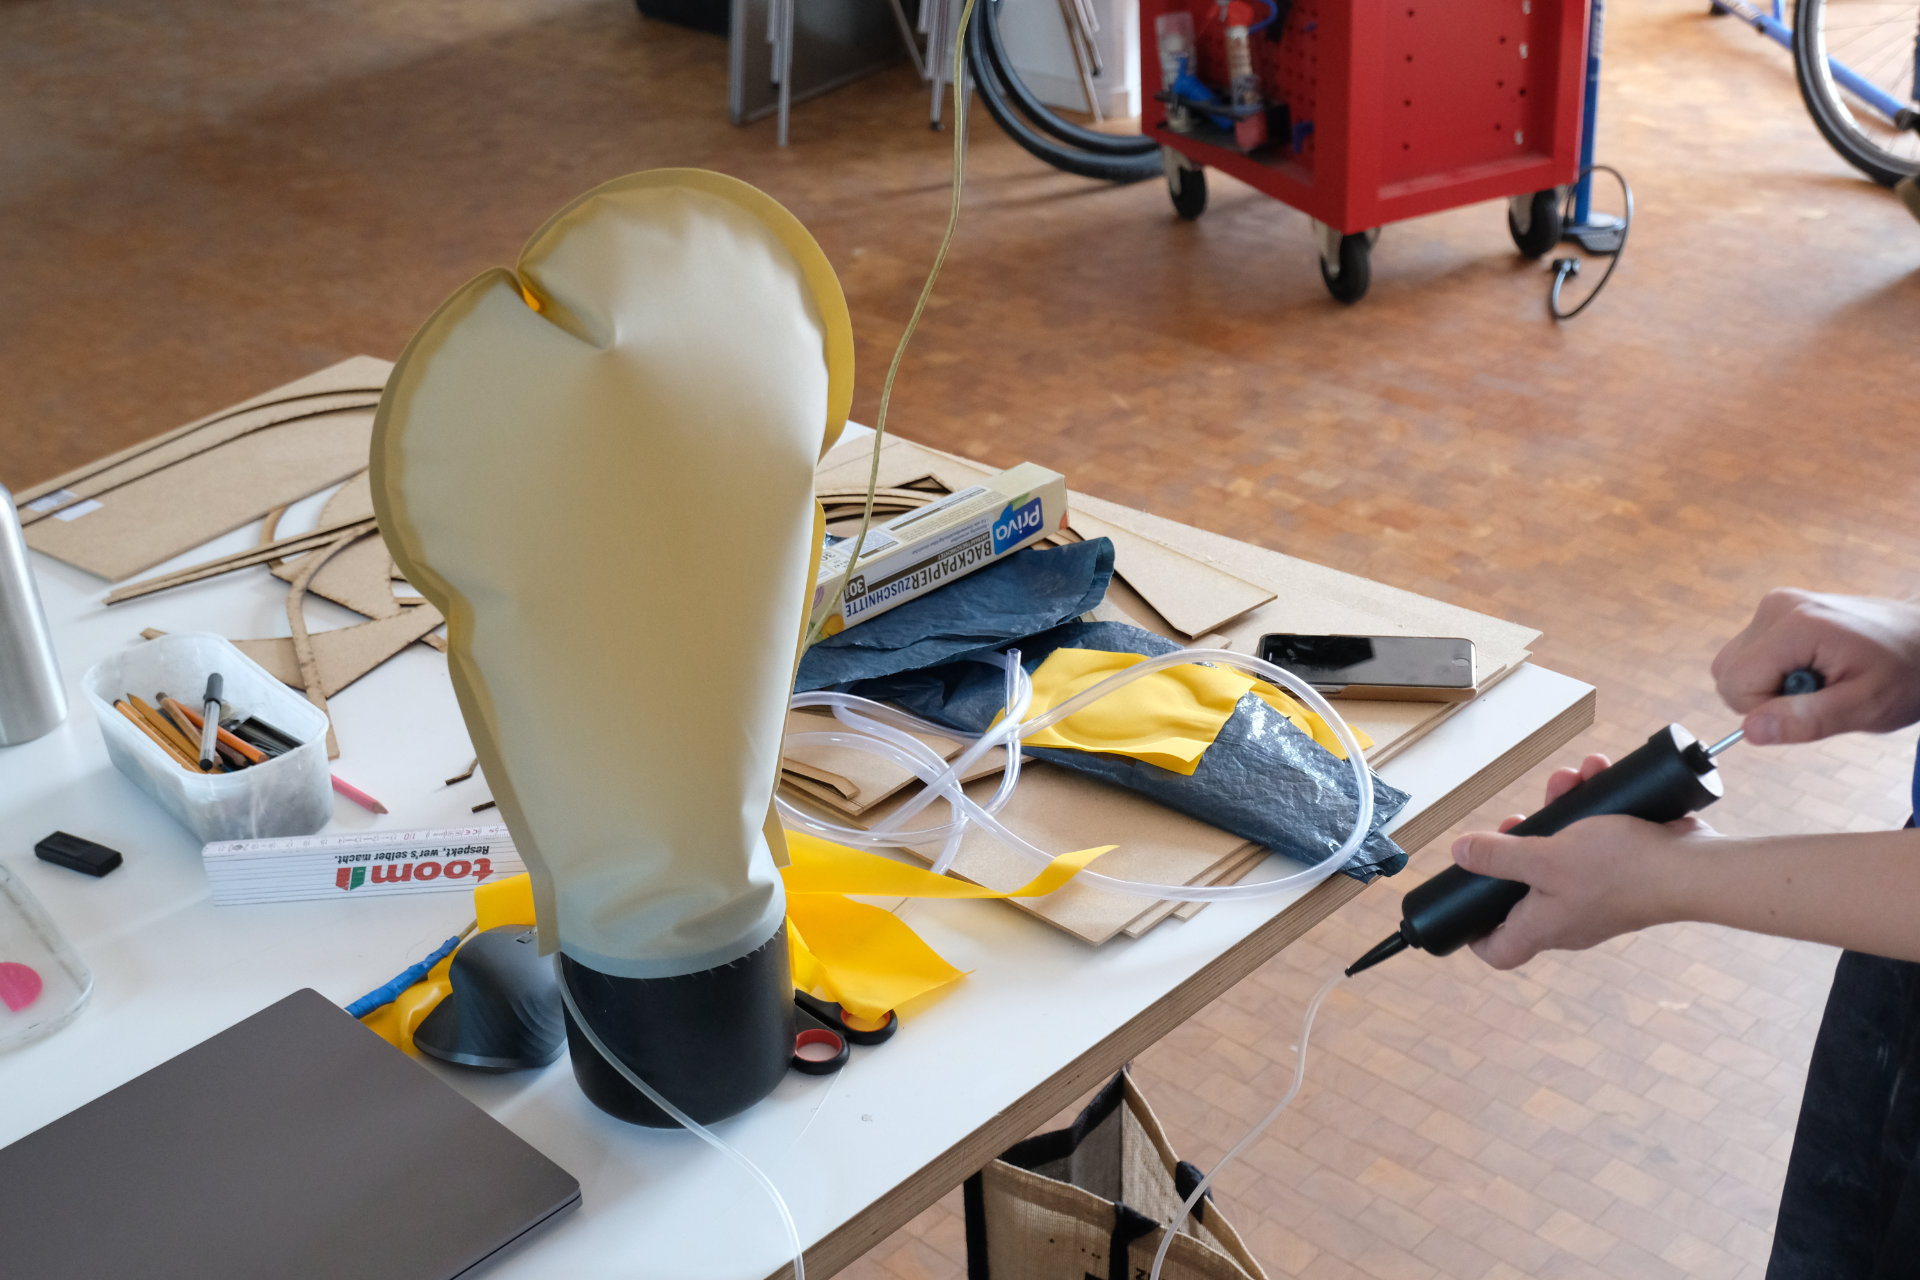
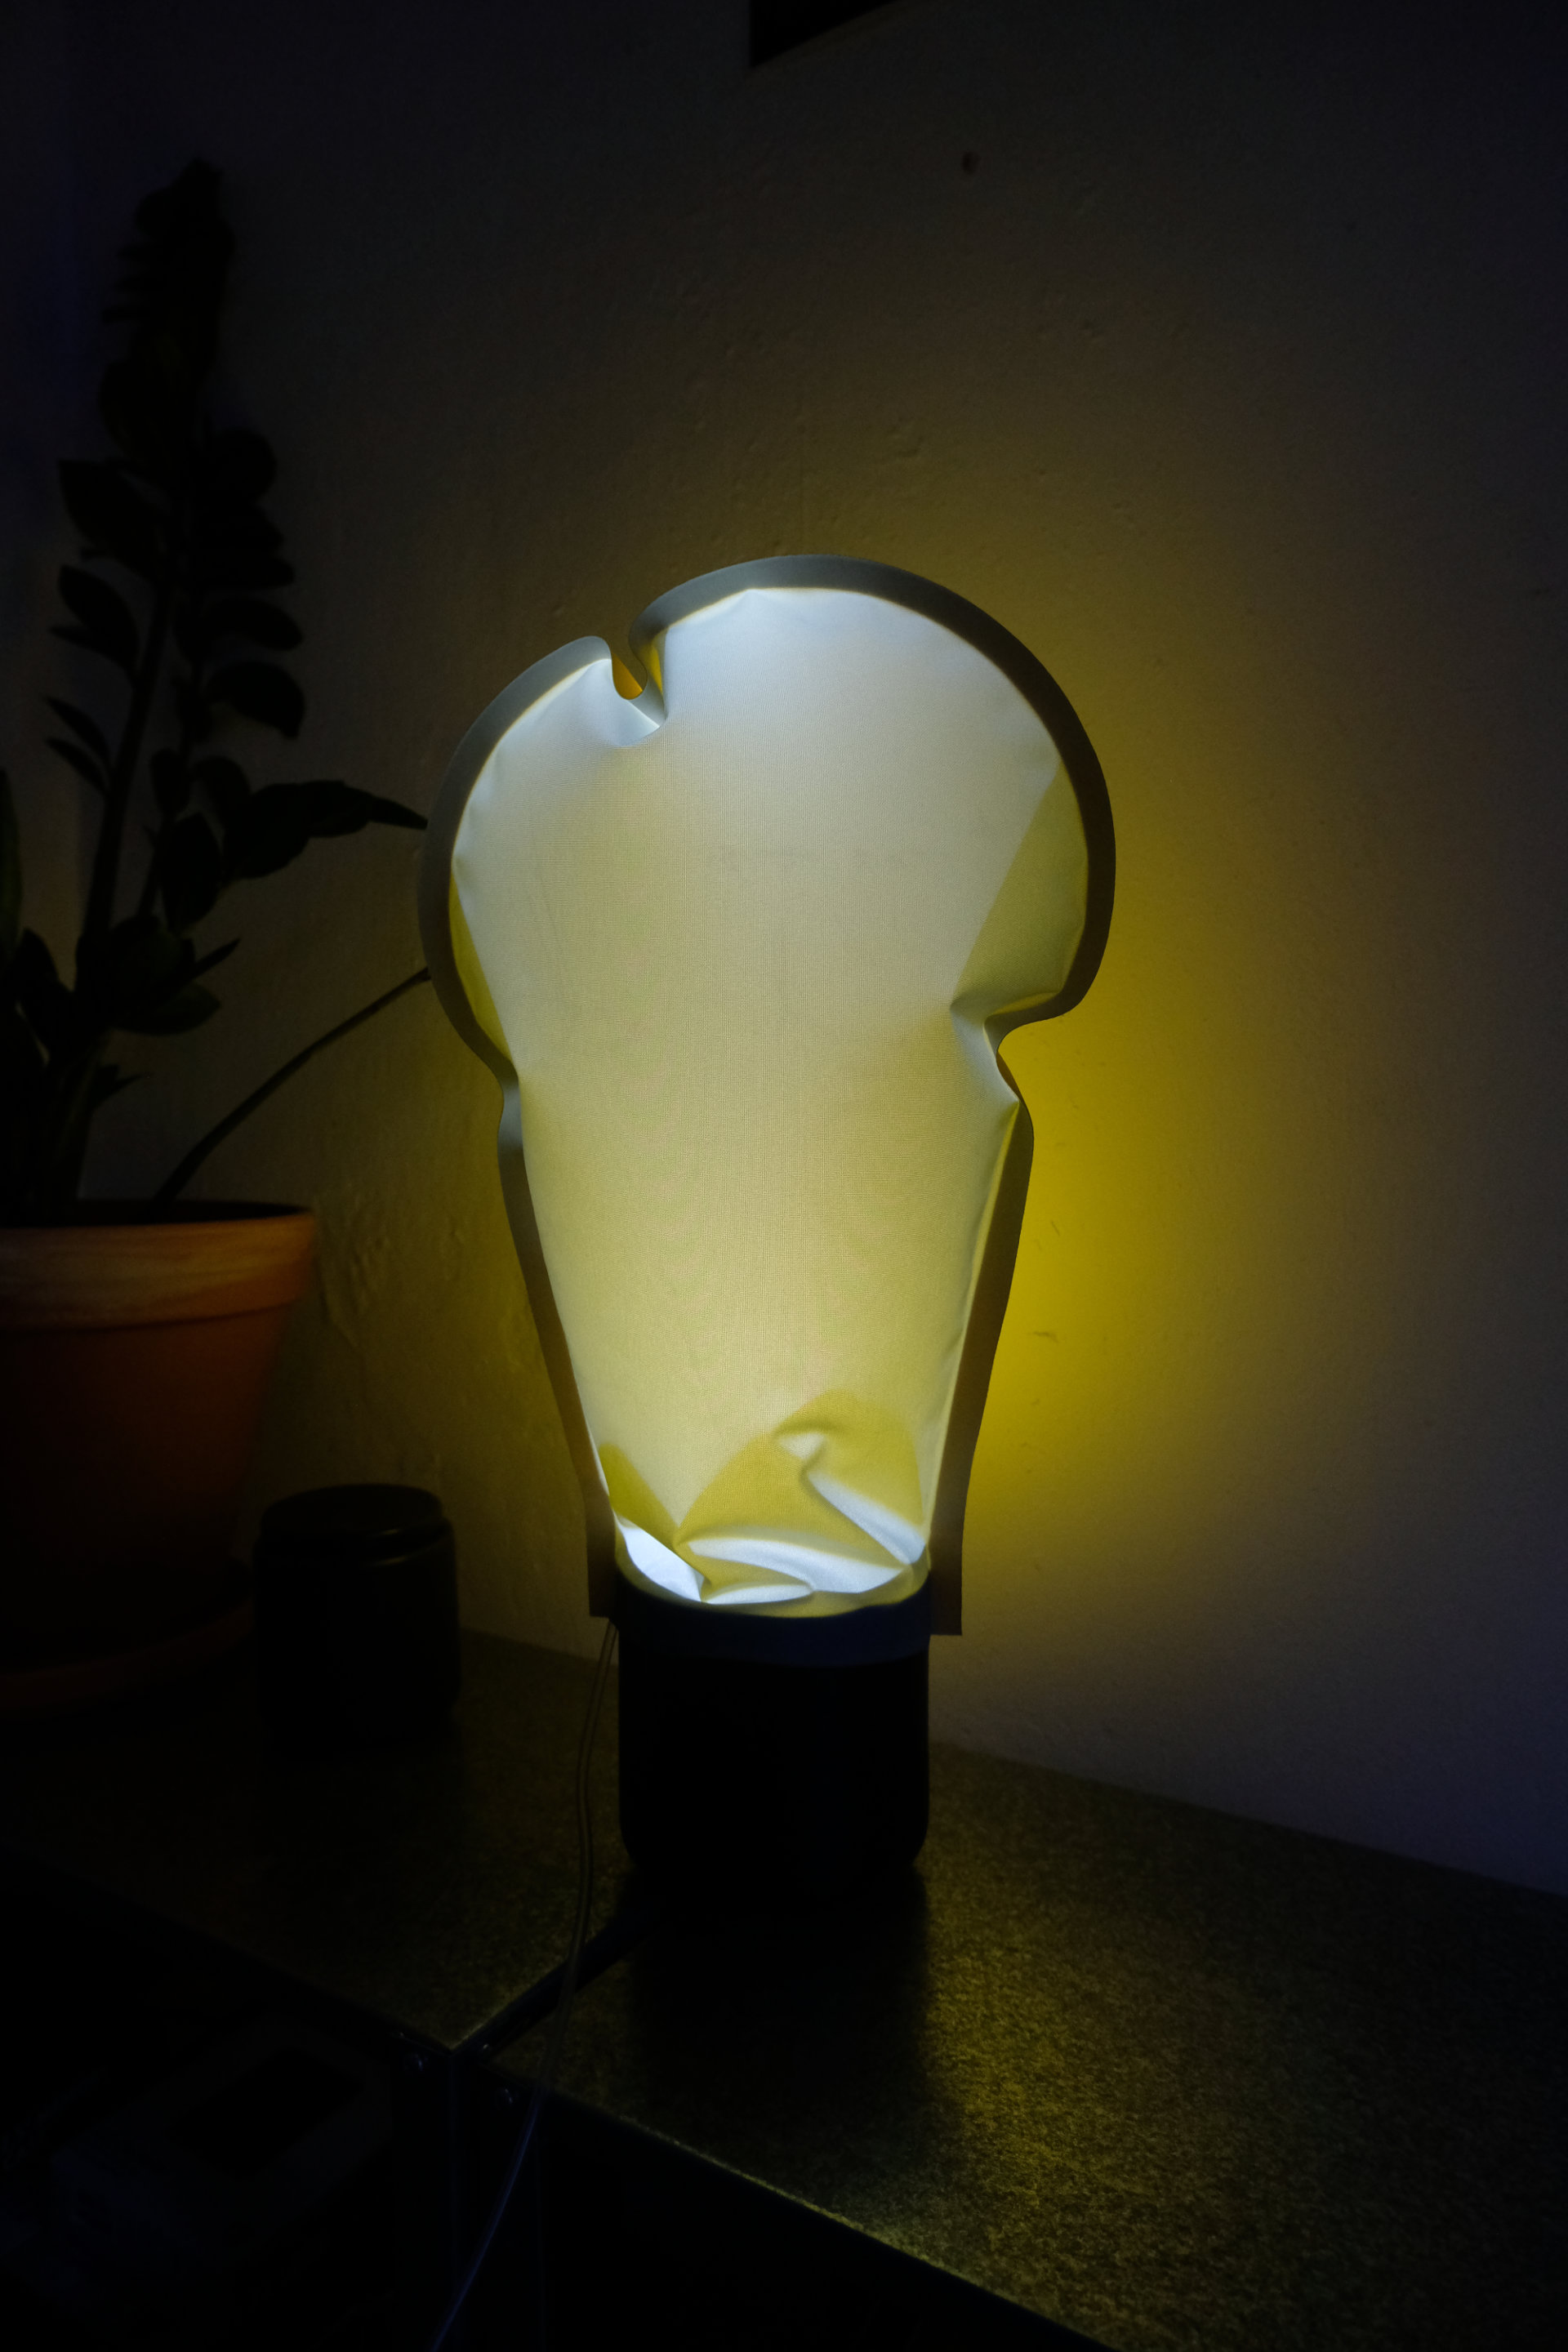
ee-bulb
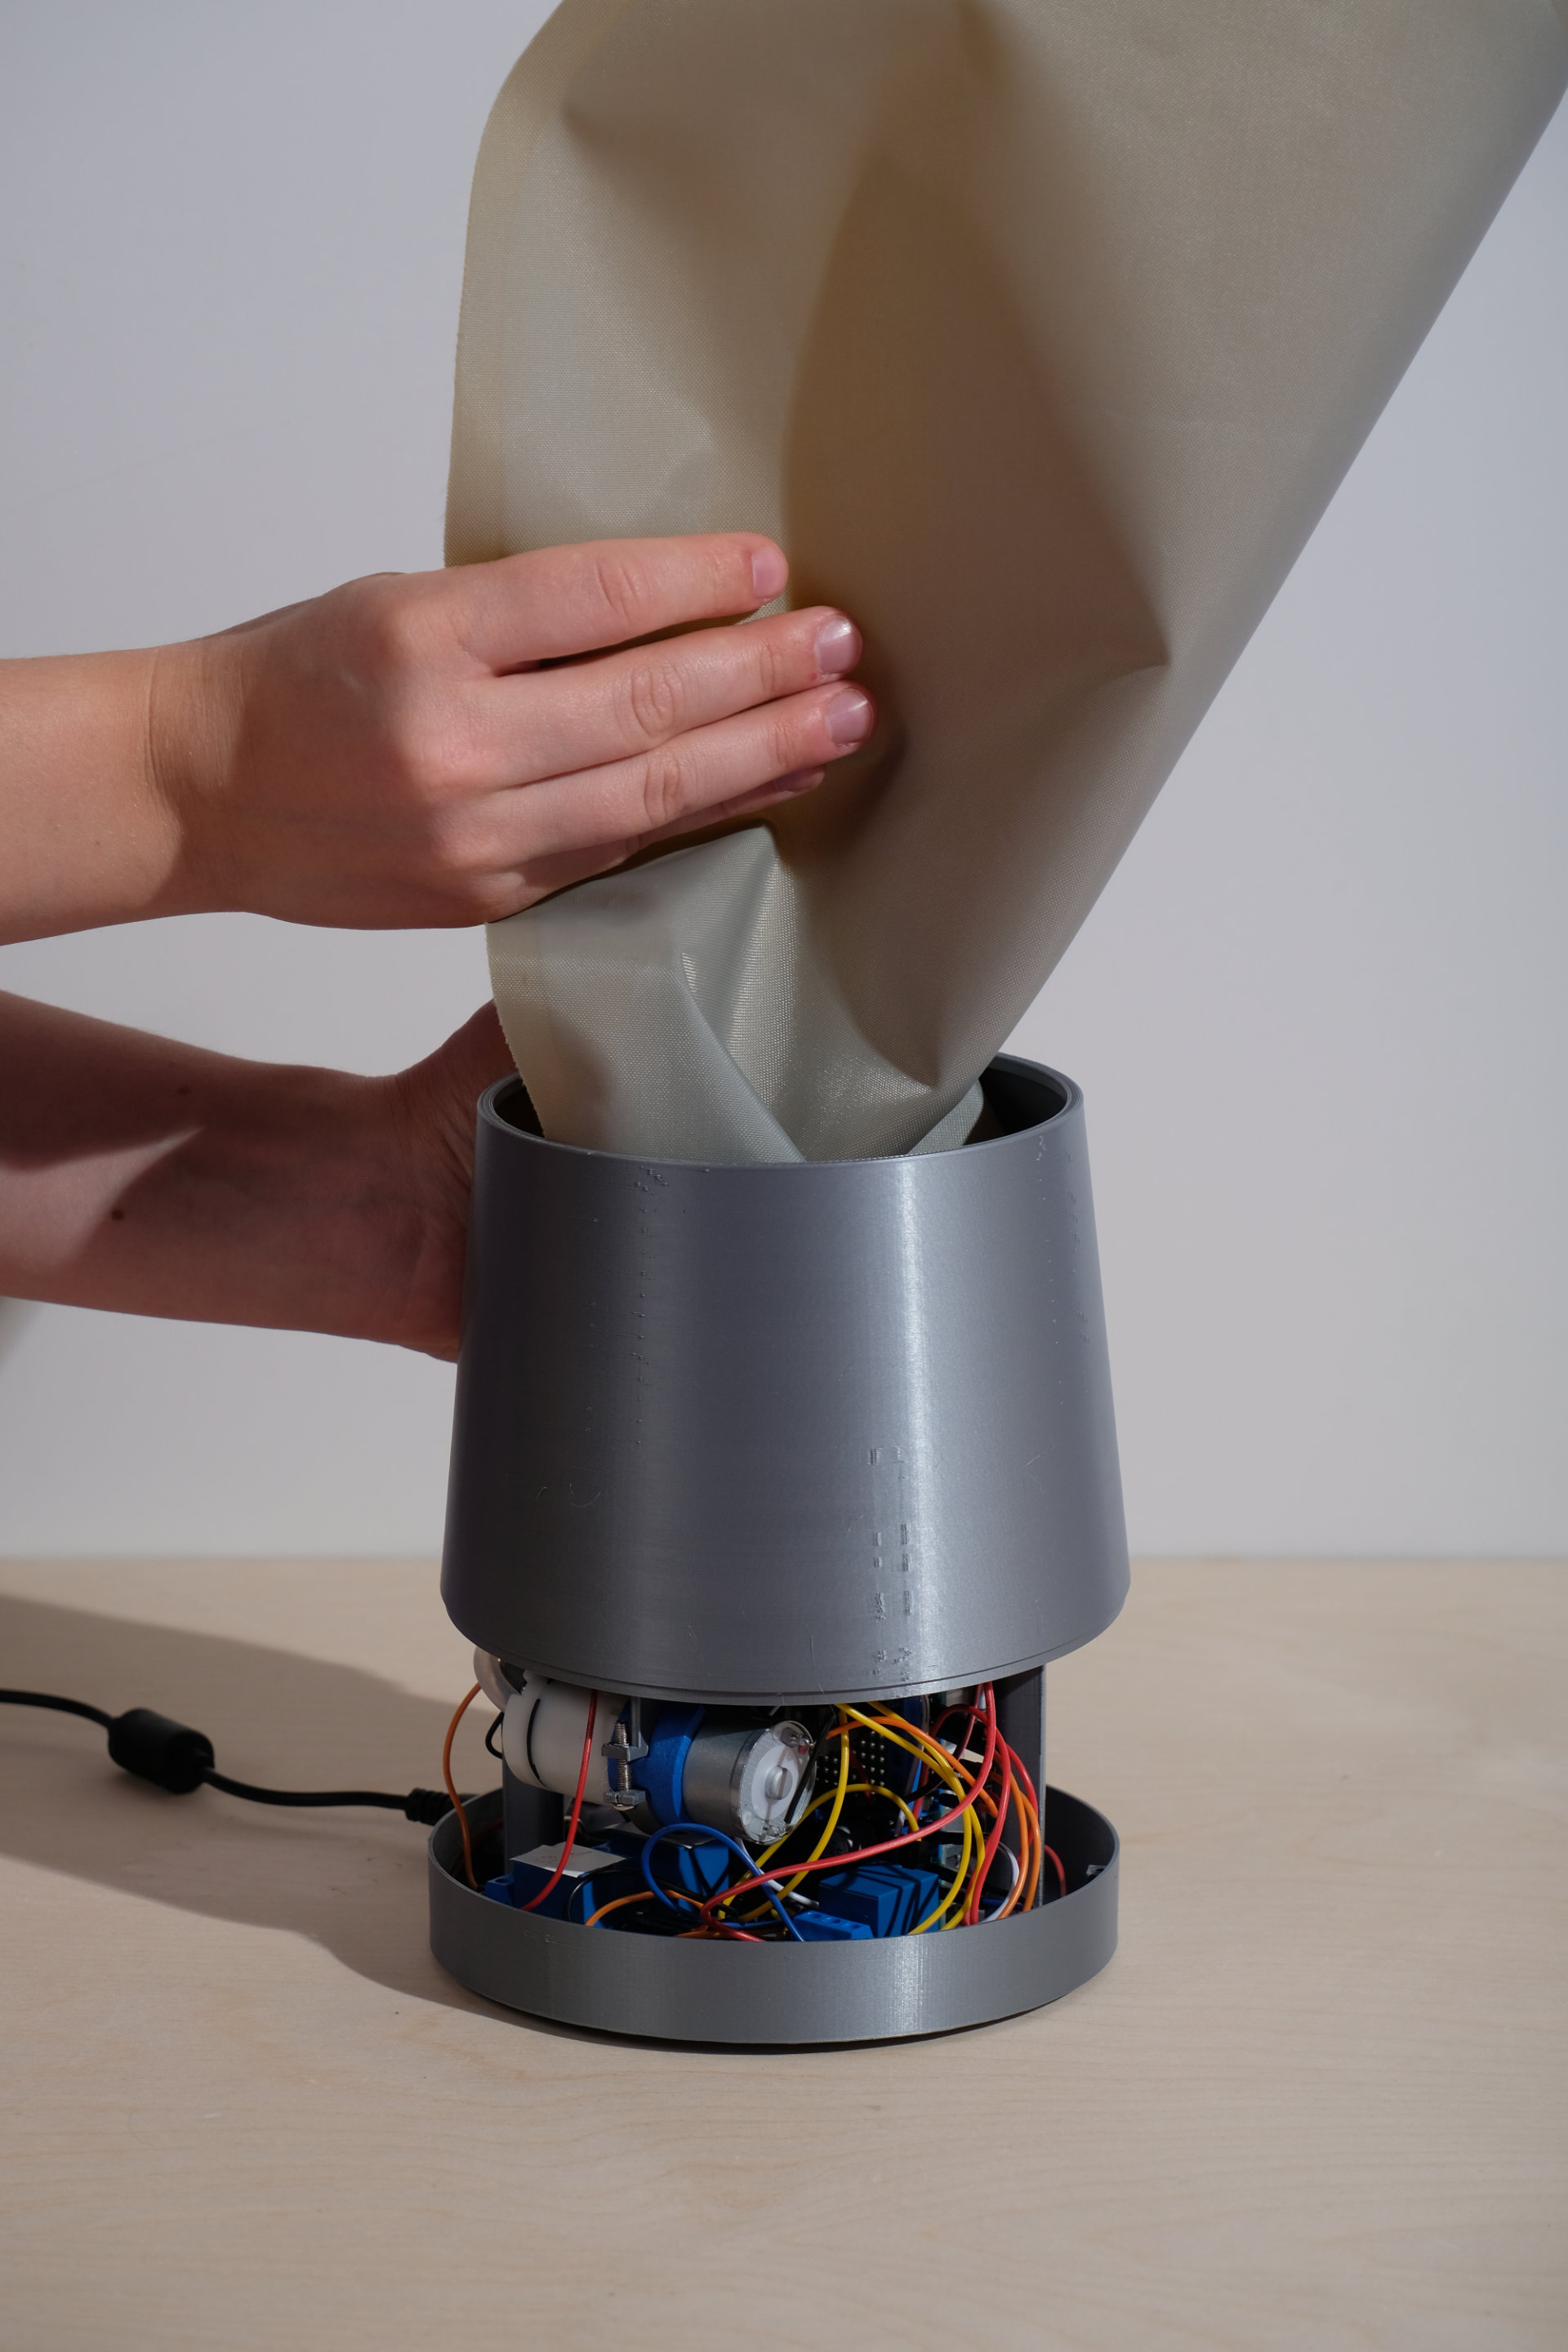
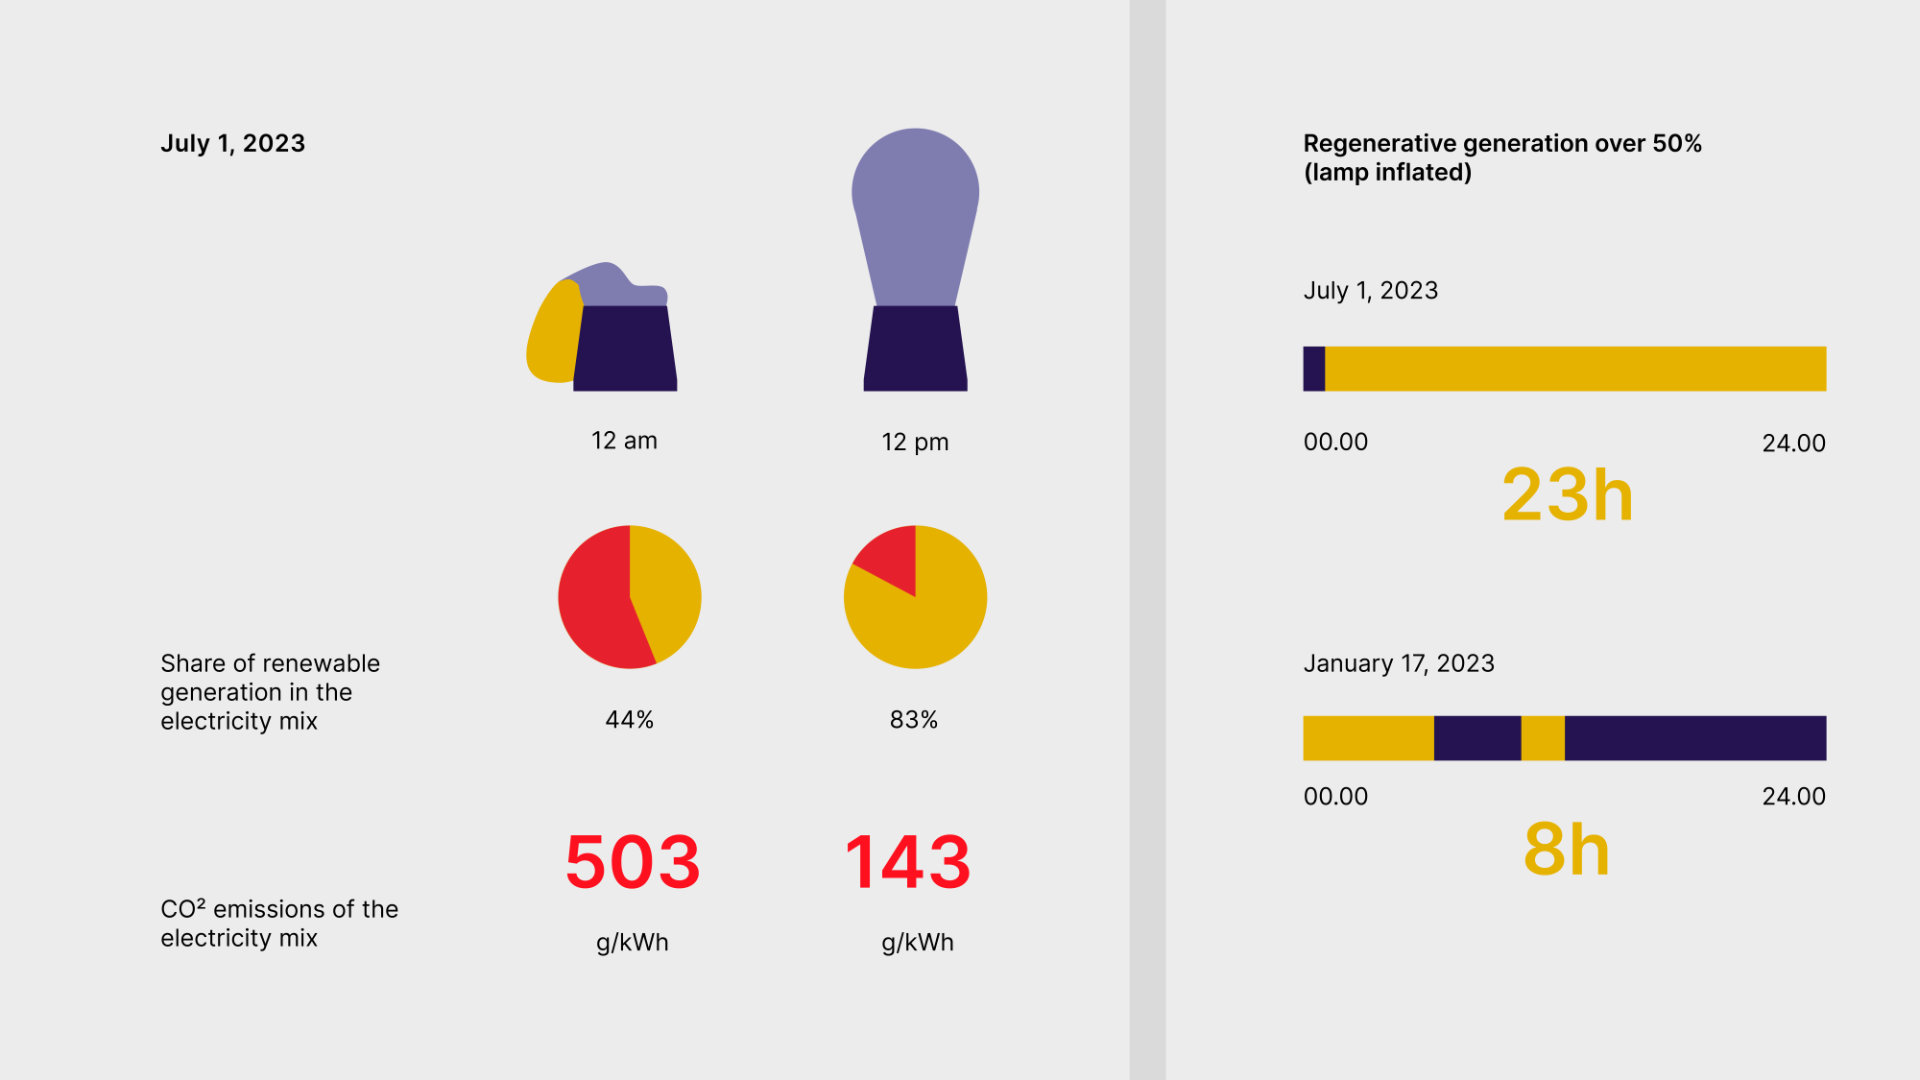
ee-bulb is a dynamic light object physicalizing real-time electricity mix data. Through a unique interface, users can turn the lamp on and off by compressing the air chamber, providing a tactile interaction with the embodied data. This distinctive feature ensures that the lamp operates only when the majority of the electricity is sourced from renewable means, reinforcing the connection between user actions and sustainable energy usage. If the share of renewable energy in the electricity mix exceeds 50%, the lamp inflates, providing a visual and tactile indication of eco-friendly energy availability. Conversely, when reliance on fossil fuels increases, the object collapses. This design aims to enhance awareness of power origins and environmental impacts, encouraging users to make conscious decisions about their energy consumption, including load shifting to times when renewable energy predominates, ultimately reducing carbon emissions.
.jpg)
.jpg)
.jpg)
.jpg)
.jpg)
.jpg)
.jpg)